Other Features

Data Formatting Help

1. On the Variables page of Metaboverse, launch the Format dataset module.
2. Upload your datatable. The datatable’s first column should be a blank cell, followed by each of the measured entities’ names. Each subsequent column should start with the sample name, followed by the corresponding measurements for each measured entity.
3. By default, calculated p-values will use the Benjamini-Hochberg p-value adjustment procedure for multiple hypothesis testing. This is a less conservative adjustment procedure ideal for exploratory data analysis. If you do not wish to use a p-value correction procedure, uncheck the appropriate box.

Note

The statistical procedures used by this module assume data are normally distributed, such as is often the case with proteomics and metabolomics data. However, for transcriptomics data, which follow a negative binomial distribution, a package, such as DESeq2 or limma should be used. The resulting fold change and adjusted p-values should then be isolated from the results, exported into a tab-delimited file, and uploaded for use in Metaboverse. This formatting tool will display the distributions of each of the samples in the uploaded dataset to assist in verifying the distributions of the underlying data.

Warning

This Format Dataset tool from Metaboverse v0.10.1 onward will display the sample distributions within the uploaded datasets. Users should examine the samples to ensure their values follow normal distributions. If the data are not normally distributed, the user will need to utilize other statistical testing in preparing their dataset for Metaboverse.

4. Select the experiment type used.
5. Provide a label for the comparison, or use the default name, and select the contol and experimental samples from the columns and assign to their appropriate group by clicking the group button (Control or Experiment).
6. For multi-condition or time-course experiments, continue to add additional groups.
7. For metabolomics data, click the Check Names button to cross-reference the names you provided with MetaboAnalyst to improve the chances that the metabolite correctly maps to the metabolic network.
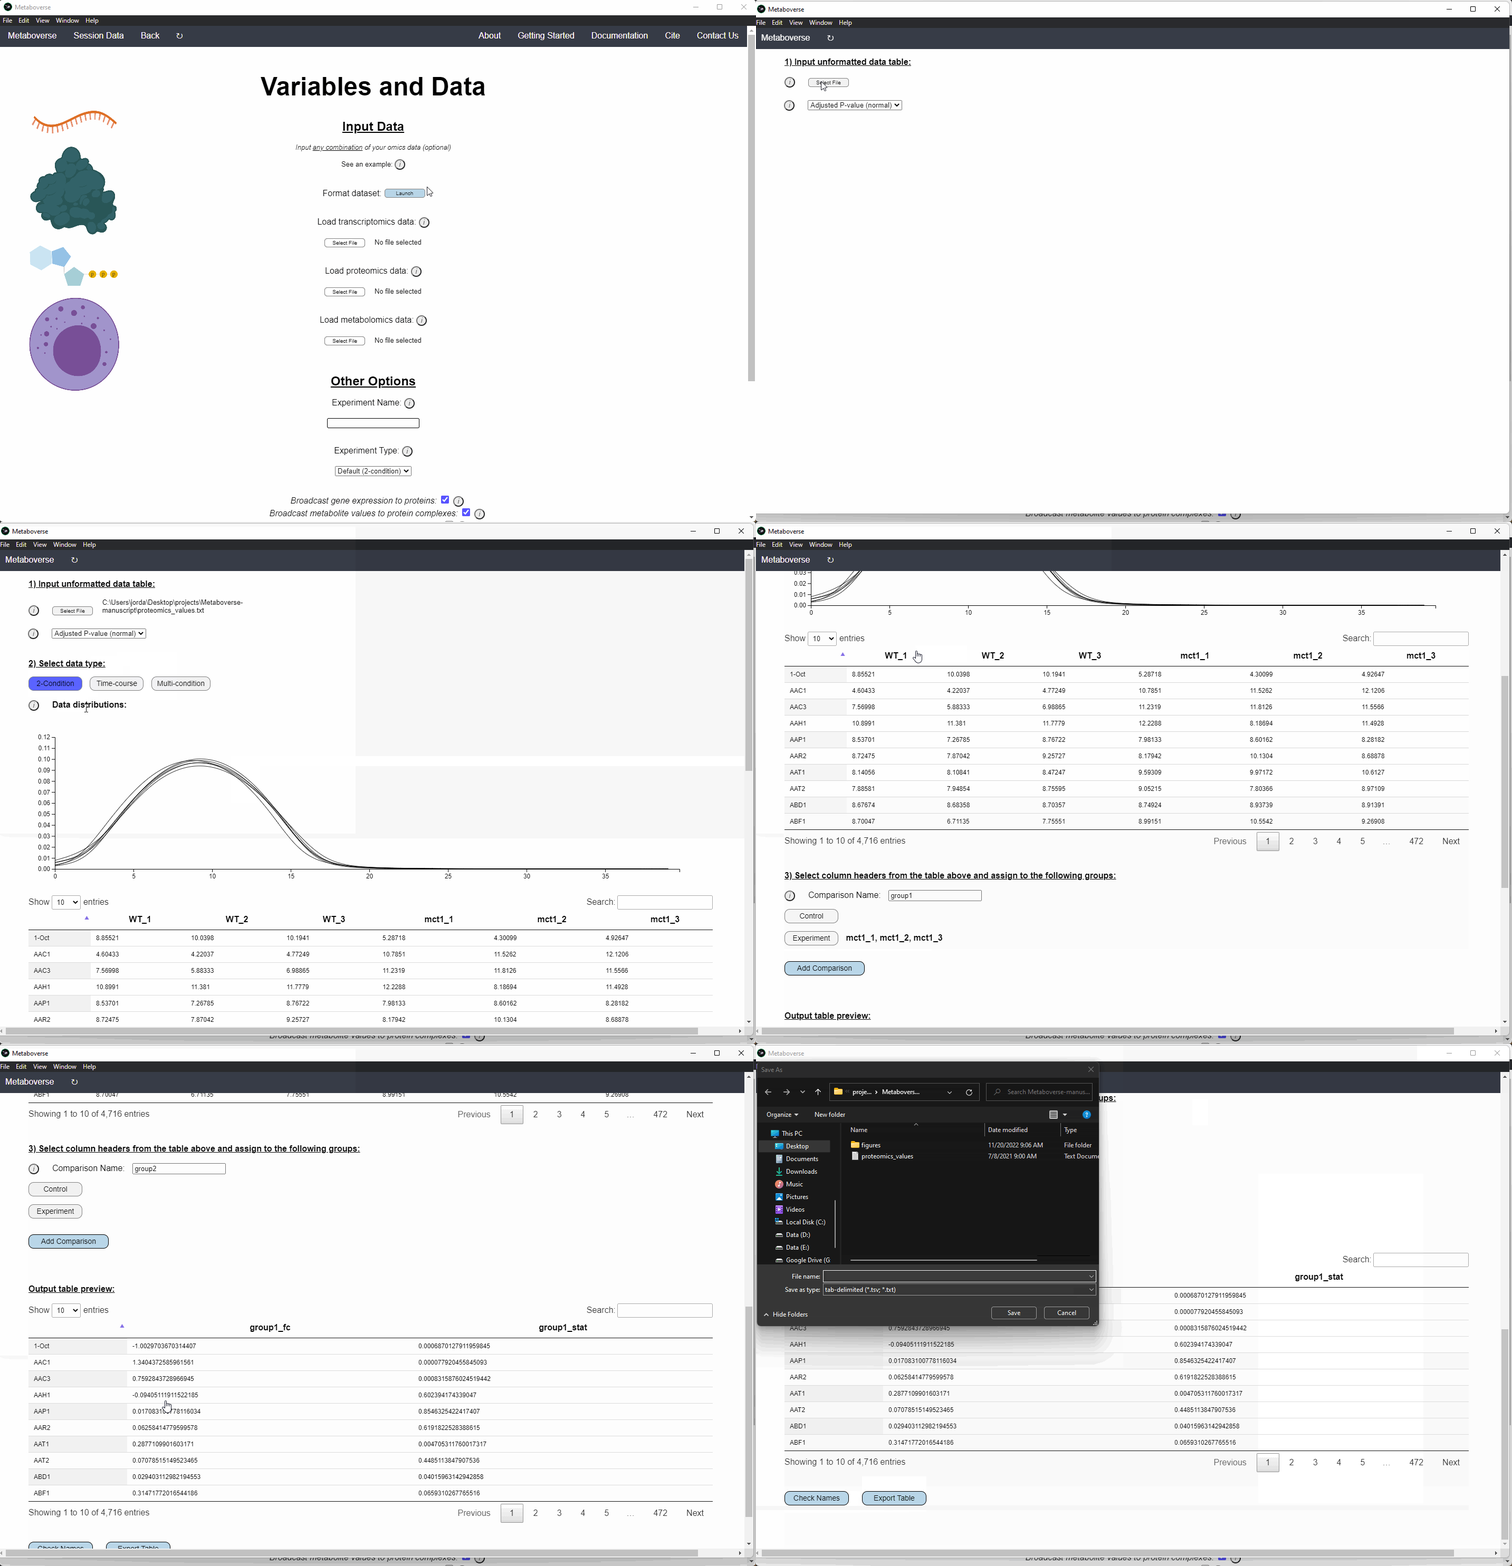
8. Export your formatted datatable.
../_images/capture_12.gif

Tracing Metabolomics Data

Currently, Metaboverse does not contain any integrated methods for handling tracing/flux metabolomics data. We chose to do so for a couple of reasons:
1. Coupling tracing metabolomics with reaction pattern searches, reaction collapses, and the other features of Metaboverse would add more dimensionality that would reduce the effectiveness of what Metaboverse has to offer.
2. Tracing metabolomics can be difficult to automate pattern searches across. For example, M+4 vs M+5 citrate could imply drastically different metabolic outcomes and is better suited for manual analysis.
3. Escher-Trace is a publicly available visualization tool that already provides the capabilities to analyze tracing data.
We strongly suggest users interested in analyzing tracing data in conjunction with Metaboverse to check out Escher-Trace. For such an analysis, users might consider analyzing the different

ionization products with Escher-Trace and analyzing derived steady-state metabolomics data (i.e. M+0) with Metaboverse’s reaction pattern search engine. Cross-referencing the outputs of these two tools may then provide biological clues for their system, such as to the downstream outcomes of differential metabolite behavior.