Walkthrough
The majority of the following walkthrough was created using Metaboverse
v0.9.0 and previous versions. If using a later version, some aspects may look/behave slightly different. We will do our best to keep these walkthroughs updated as any relevant components change. If you have any questions, please let us know here.Analysis Video Walkthrough
You can watch the Metaboverse walkthrough video here, or continue below for a more detailed walkthrough.
Downloading Metaboverse
You can access the most recent version of Metaboverse for your operating system at: https://github.com/Metaboverse/Metaboverse/releases.
Using a Test Dataset in Metaboverse
If you would like to practice using Metaboverse with a test dataset, several are included with each distribution of Metaboverse. You will need to unzip the
test_data file within the Metaboverse folder you just downloaded and unzipped.
This vignette using the mct1 Δ timecourse dataset published with the original Metaboverse manuscript. This dataset is included with each distribution of Metaboverse in the
test_data/yeast-multiomics-timecourse directory.Getting Started in Metaboverse
To launch the Metaboverse desktop app, open the Metaboverse app within the unzipped folder you downloaded.
1. If this is your first time analyzing a given dataset, you should press
Skip on the opening page.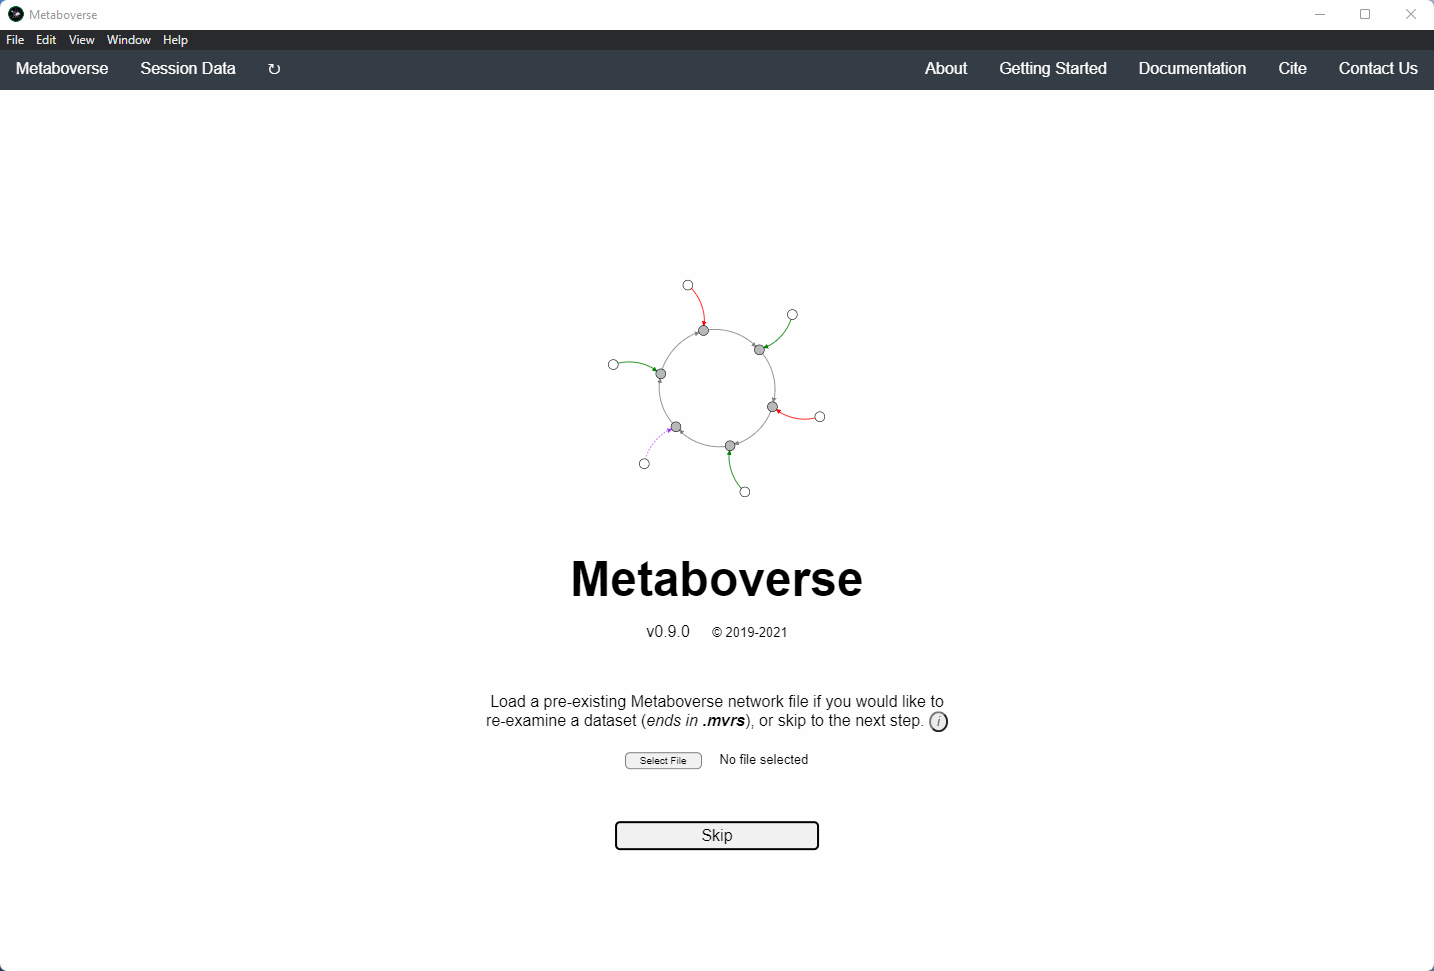
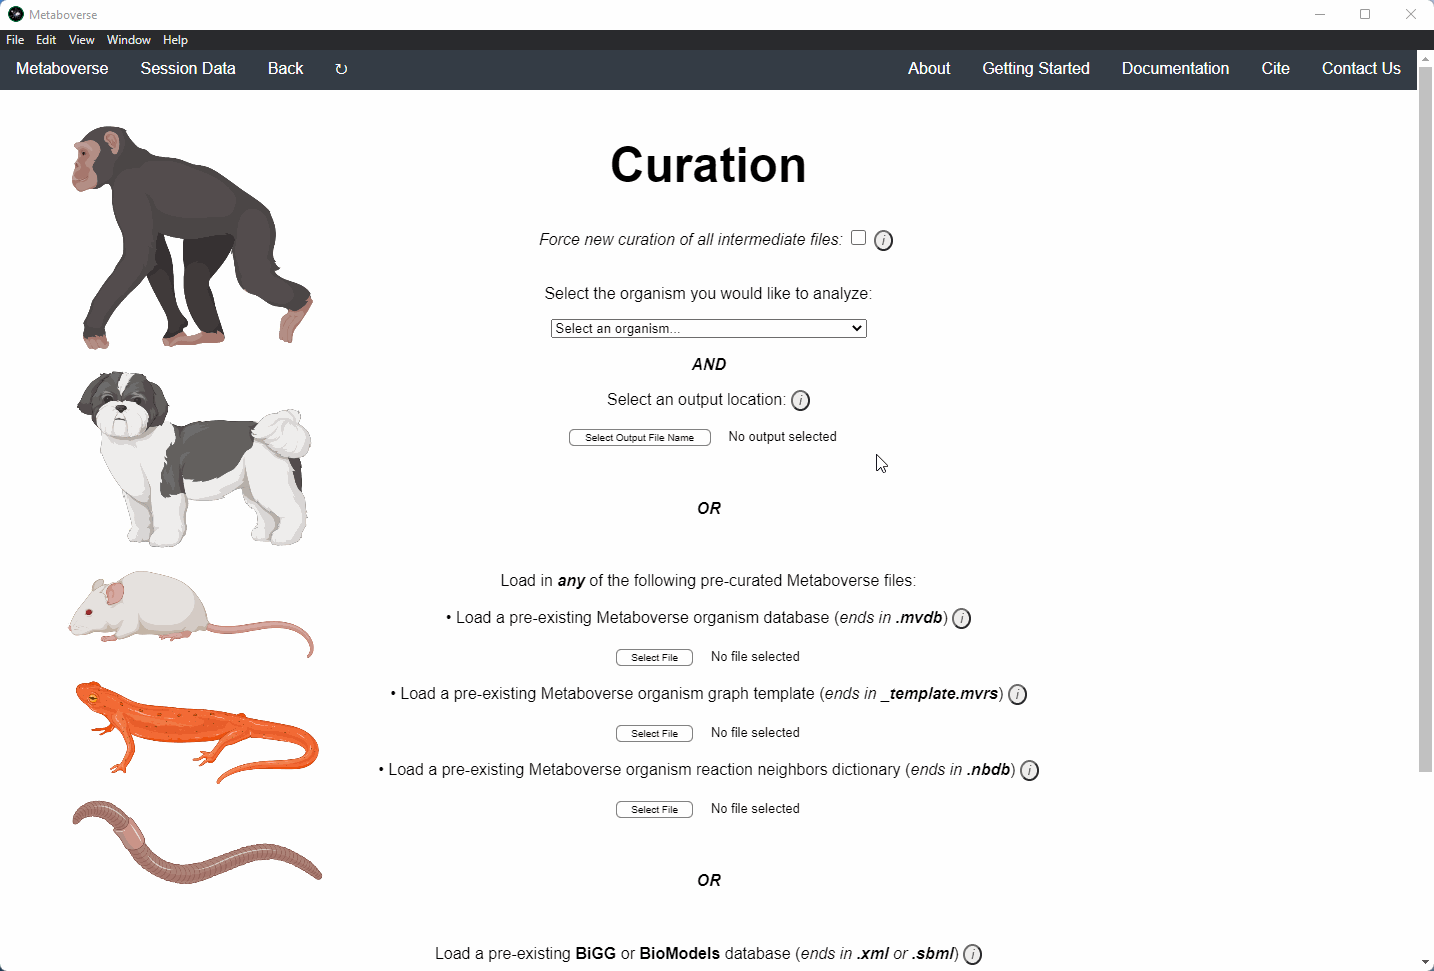
2. Select the organism of interest you would like to model your data.
3. Select an output location for files generated by Metaboverse.
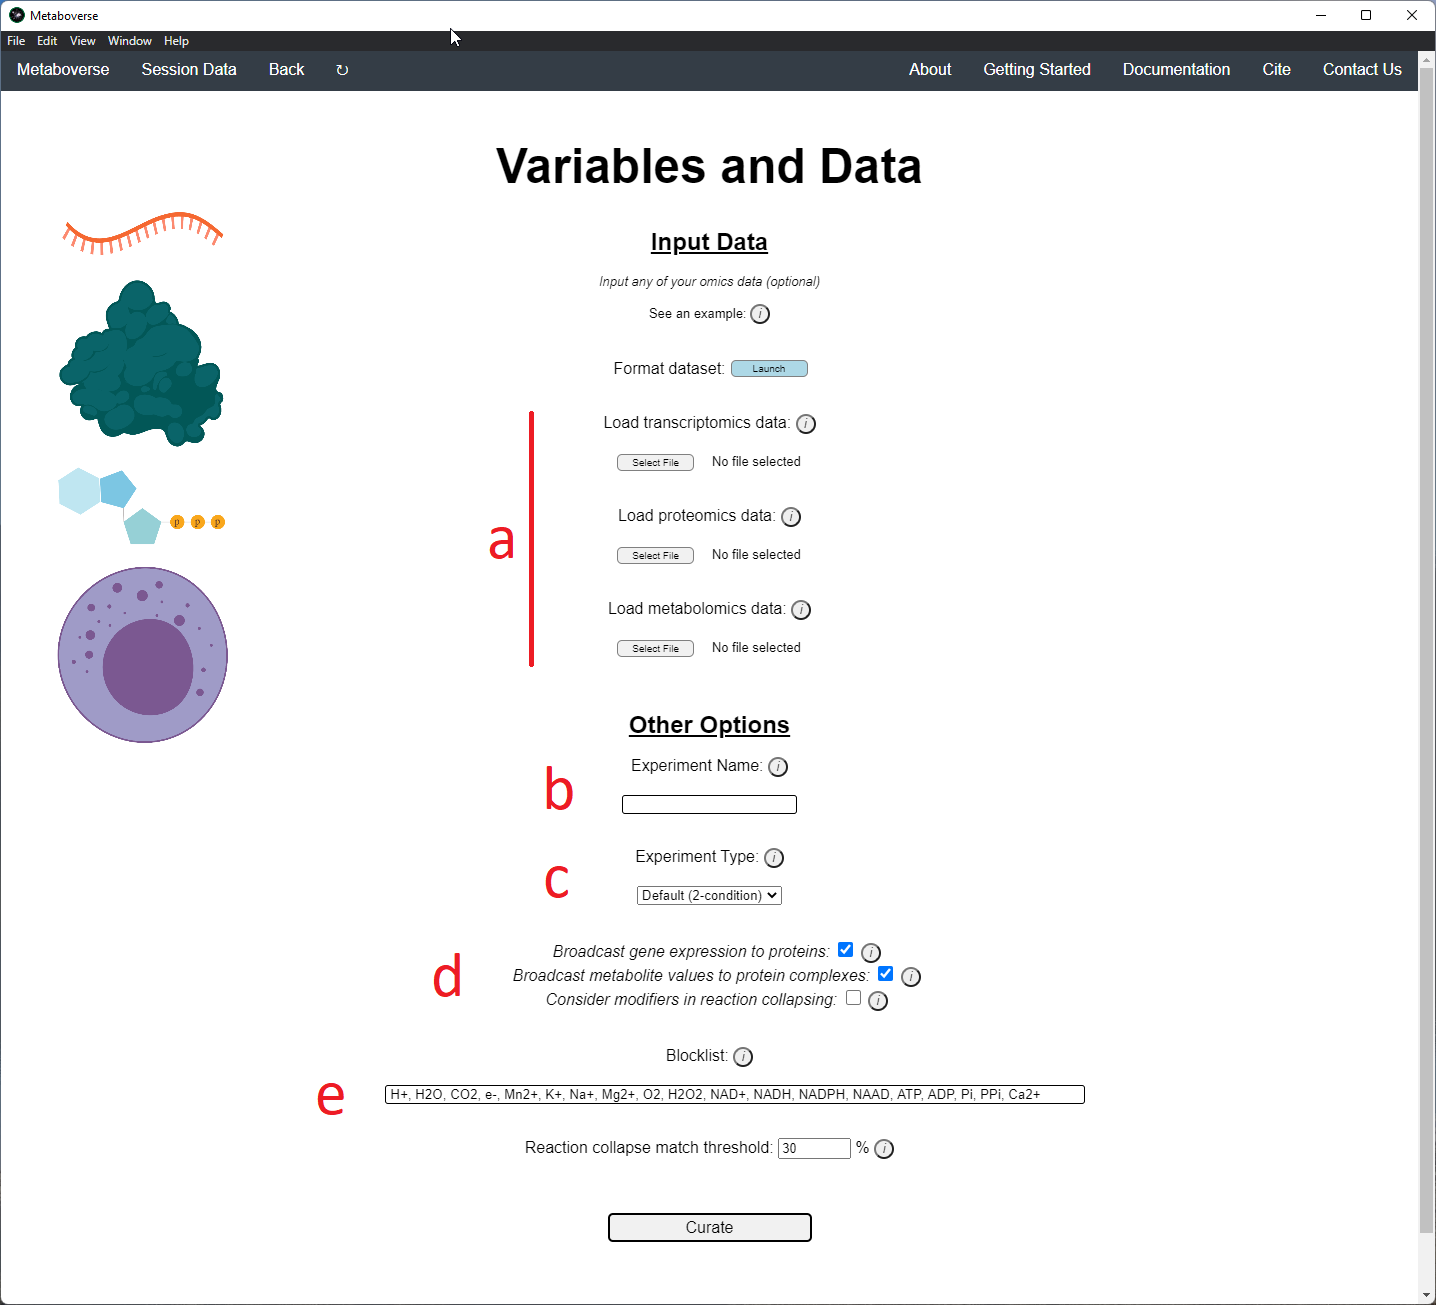
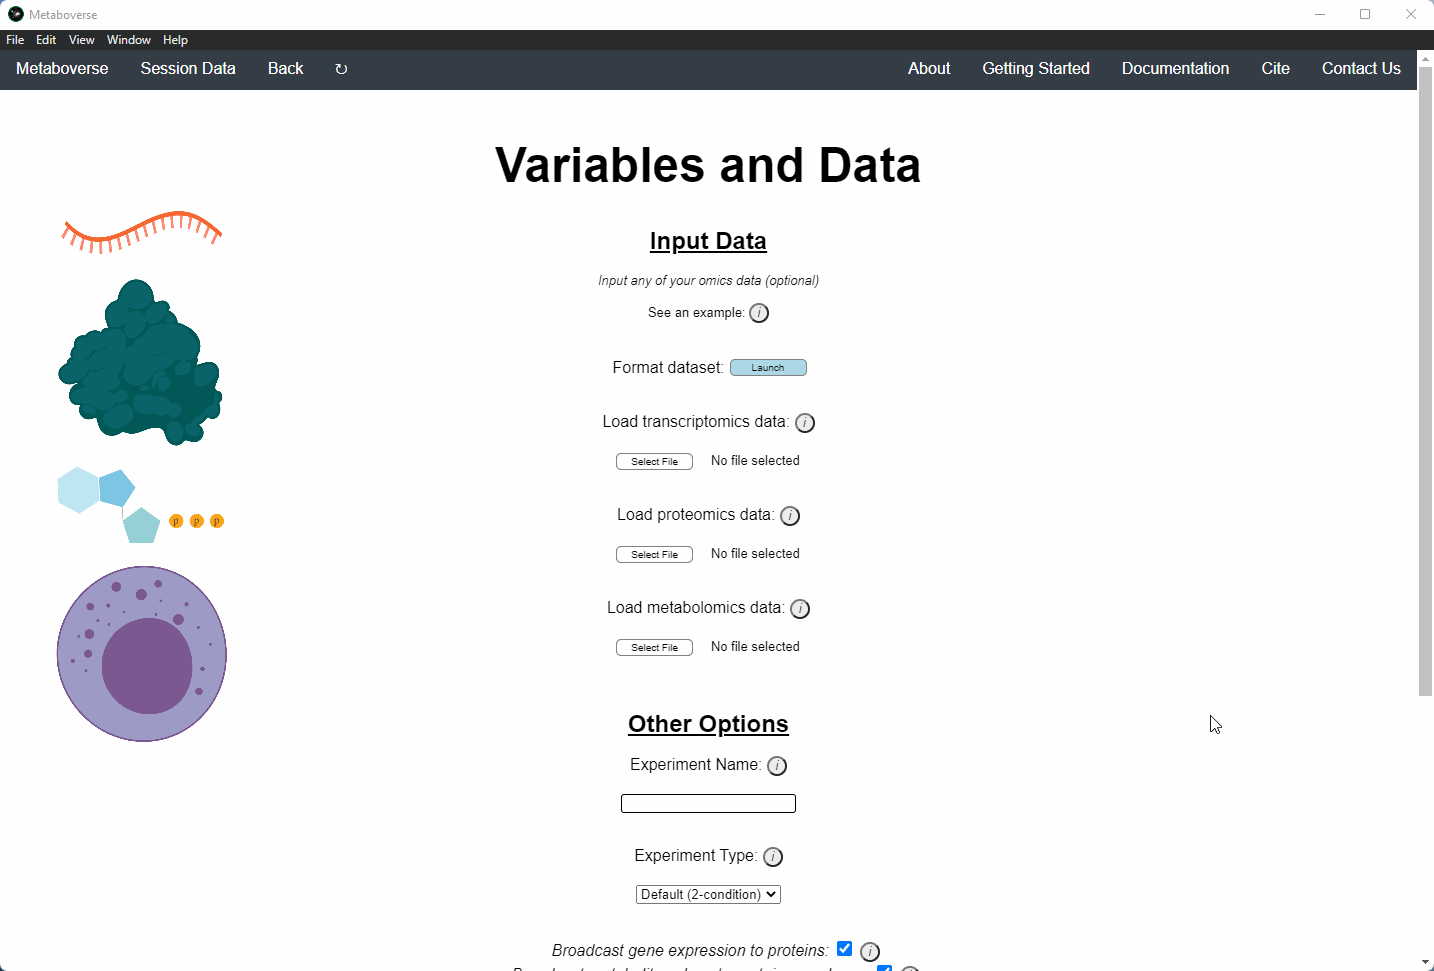
4. Provide the following variables for your model.
a) Provide the appropriate data files for your -omics data. Please see the Data Inputs sub-heading for more information.
b) Provide a name for your experiment/model.
c) Provide the appropriate experimental type. If you are providing timecourse or multi-condition data, a second entry space will open to input sample names.
d) Select these modification options if desired.
- Broadcast gene expression to proteins: Check to broadcast gene expression values to proteins when protein values are not available (checked by default).
- Broadcast metabolite values to protein complexes: Include metabolite measurements in inferring protein complex level.
- Consider modifiers in reaction collapsing: Check to include modifiers in reaction collapsing. Catalysts are included as outputs, inhibitors are included as inputs. Please refer to documentation for more information.
e) Add or remove any items you wish to not be displayed in the network visualizations.
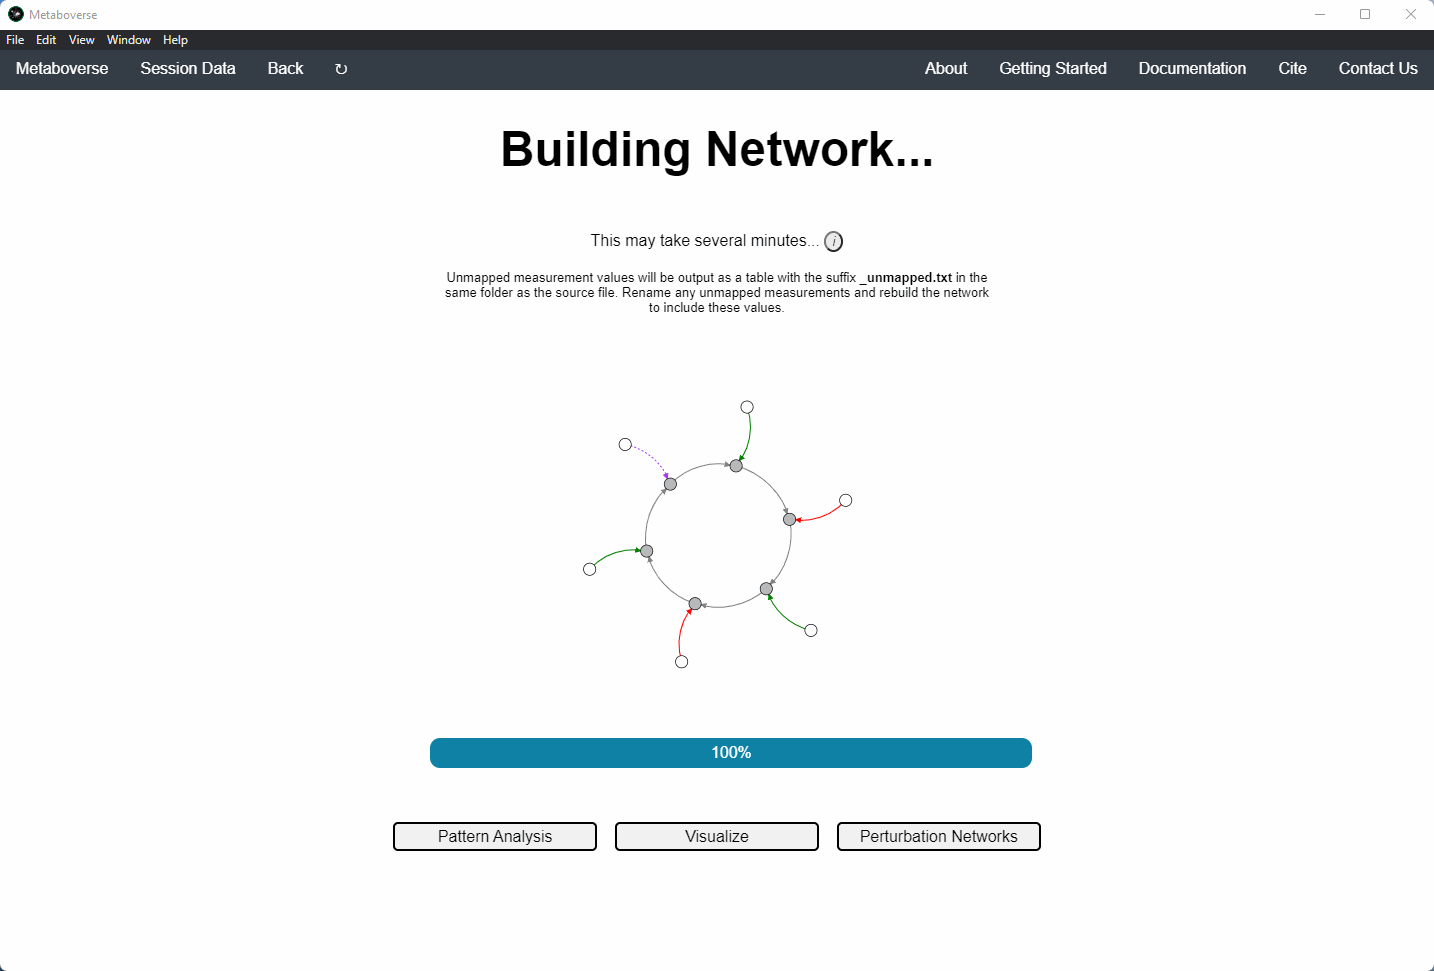
5. Build your network model. After your network model has been built, you will have the option to perform regulatory hotspot identification, model perturbation networks, or perform general visualization of pathways and components by clicking on the appropriate buttons at the bottom of the screen that will appear once Metaboverse has finished processing your data.
Reaction Pattern Analysis
Regulatory patterns can be searched for in the global reaction network using this page. Users can select different reaction pattern types by clicking on the appropriate buttons and adjusting their thresholds as necessary.
Currently, these reaction pattern types are available:
1. Average: A reaction whose absolute difference between the average measured values of reactants and the average measured values of products is greater than or equal to the threshold.
2. Sustained: Find instances of sustained perturbation along a reaction where there are both an input and an output that are not the same molecule with changes above the selected threshold.
3. ModReg: Find instances with one regulated modifier and one core component in the reaction.
4. TransReg: Find instances where a component is the same for input and output, is regulated, along with a modifier being regulated.
5. Enzyme: Find instances of two neighboring reactions, both with at least one non-metabolite component that passes the specified threshold.
6. Metabolite: Find instances of two neighboring reactions, both with at least one metabolite component that passes the specified threshold.
7. MaxMax: A reaction whose absolute difference between the maximum measured value of reactants and the maximum measured value of products is greater than or equal to the threshold.
8. MaxMin: A reaction whose absolute difference between the maximum measured value of reactants and the minimum measured value of products is greater than or equal to the threshold.
Identified reaction patterns can be sorted for the user using multiple methods:
1. Sort FDR: e multiplied by the geometric mean of the relevant p-values to the reaction pattern components are calculated, which roughly leads to a generalized version of a false discovery rate procedure [ref].
2. Sort Statistical Significance: Either the relevant or maximum reactant, product, and/or modifier p-values are considered in sorting.
3. Sort Magnitude Change: Either the relevant or maximum reactant, product, and/or modifier fold changes and the net change across the reaction are considered in sorting.
4. Sort Number of Pathways: Reaction patterns annotated in more pathways are prioritized.
Users can then select a given reaction pattern, view the pathways that reaction is present in across the global reaction network, select a pathway to view, and see all other patterns of that type available in that pathway. In the
Reaction-Pathway Membership box, a simplified glyph of the reaction is drawn, with inputs (substrates) on the left of the reaction node and outputs (products) on the right of the reaction node. Modifiers and input/output types are not shown in this simplified glyph.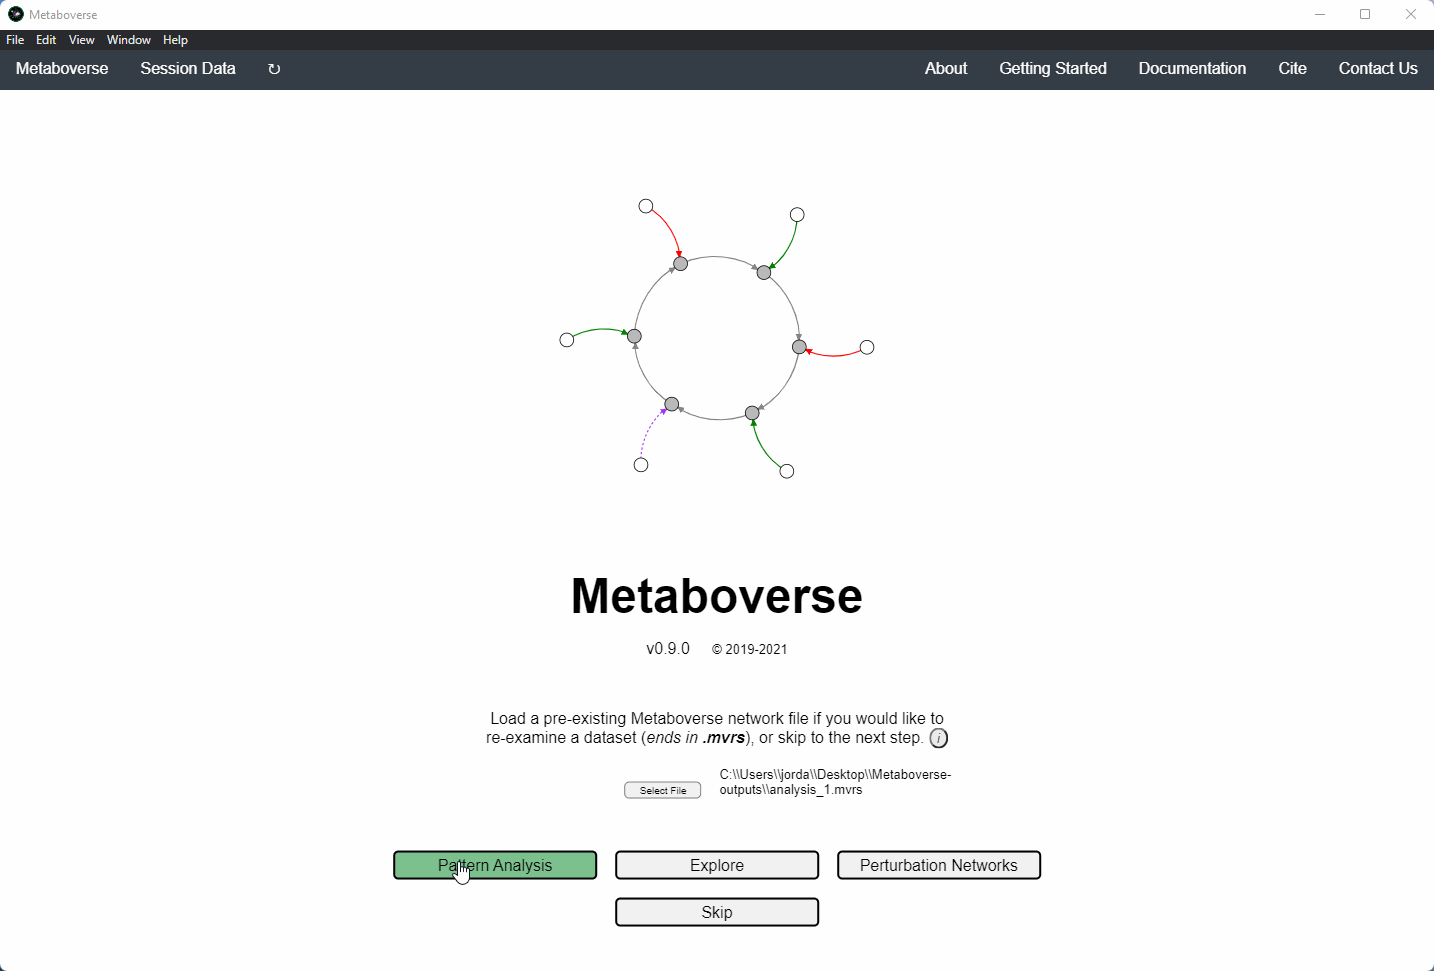
If the model includes time-course or multi-condition data, the patterns present at each timepoint or condition can be viewed.
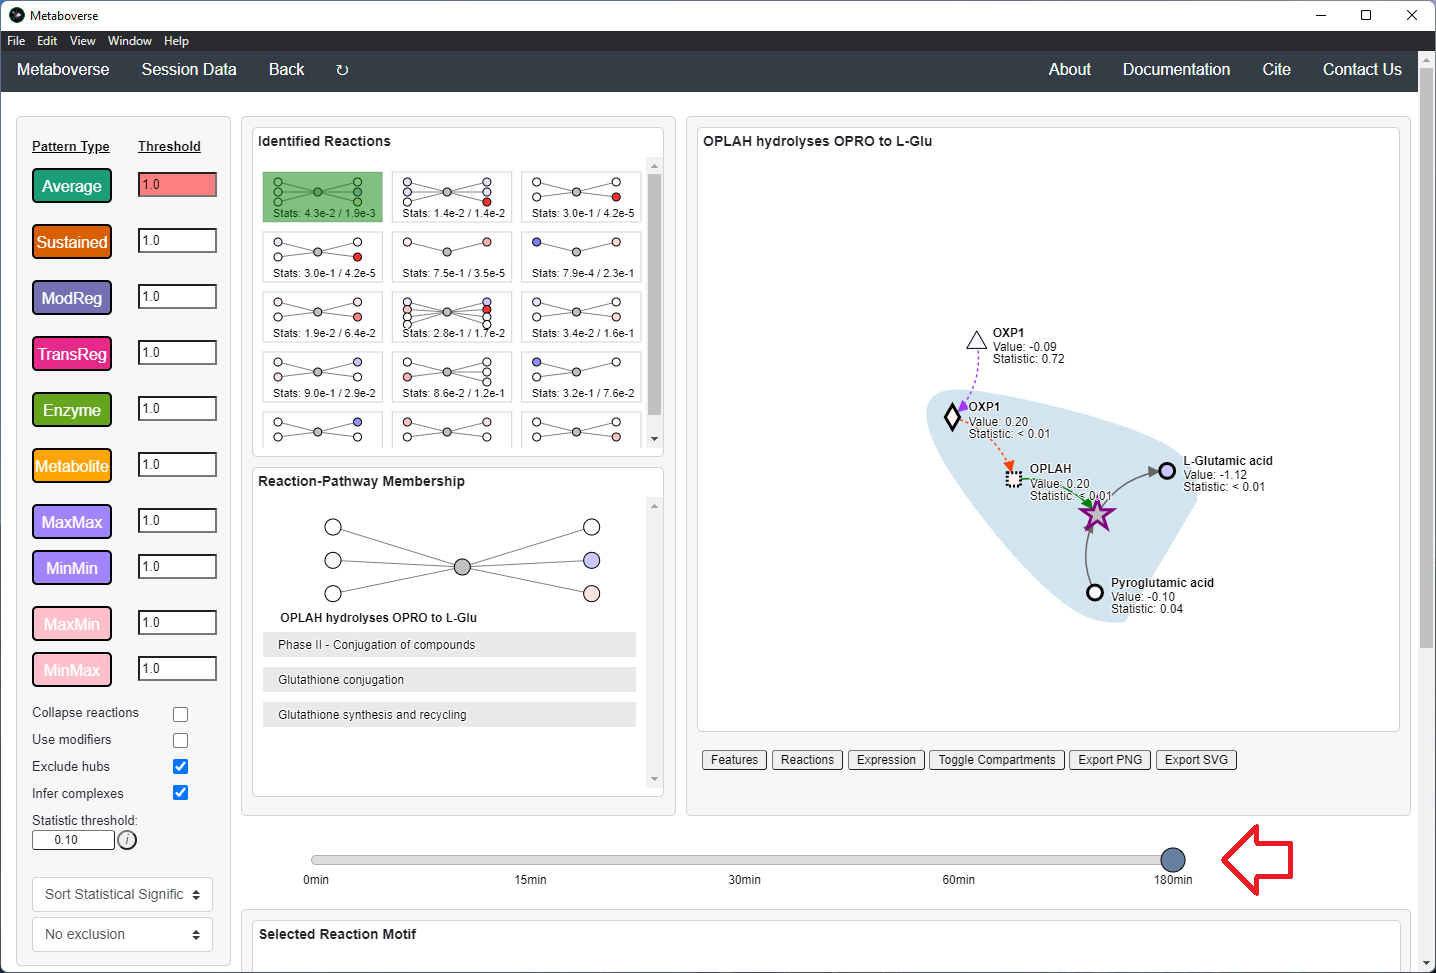
Users can also choose to include the following modifications in the reaction pattern search:
- Collapse reactions: Search for reaction patterns using collapsed reaction representations for instances where intermediate reaction components are not measured.
- Use modifiers: Include modifiers in reaction pattern analysis. Catalysts are included as outputs, inhibitors are included as inputs. You will need to re-run the reaction pattern analysis to include modifiers.
- Exclude hubs: Exclude high-hub components from consideration in the reaction pattern search. This will remove hubs with more than 100 connections. You will need to re-run the reaction pattern analysis to include modifiers.
- Infer complexes: Infer protein complex levels using complex component measurements during pattern searching.
- Statistic threshold: Define the statistical threshold to bold nodes in visualization. If provided values are confidence intervals, nodes will be bolded if selected confidence intervals values do not overlap.
- Dropdown 1 - Sorting type: Select how to sort reaction patterns.
- Dropdown 2 - Exclusion: Select a time-point or condition to exclude. In other words, if we were analyzing time-point 1, we could exclude any of the patterns that were also present in time-point 0.
Additionally, users can choose how to sort identified reaction patterns, or choose to not return reaction patterns for the selected time-point or condition that were also found in another time-point or condition. For time-course or multi-condition experiments, a pane will appear that will display the behavior of all reaction components across all time-points or conditions.
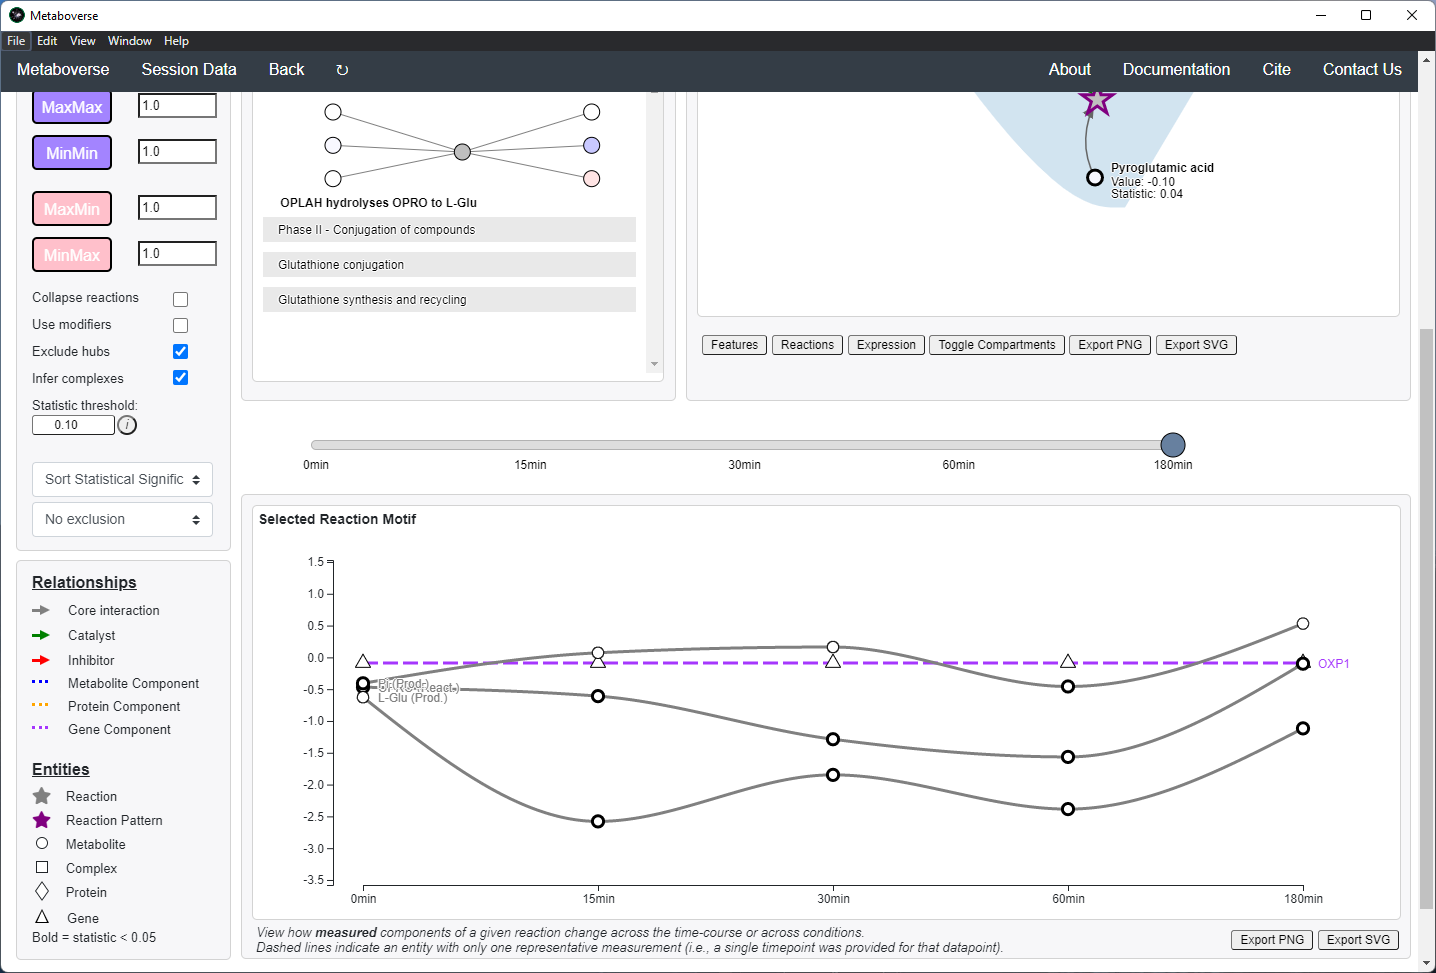
For time-course and multi-condition data, a line plot is drawn for a selected reaction with the behavior of that reaction’s components across all time-points or conditions.
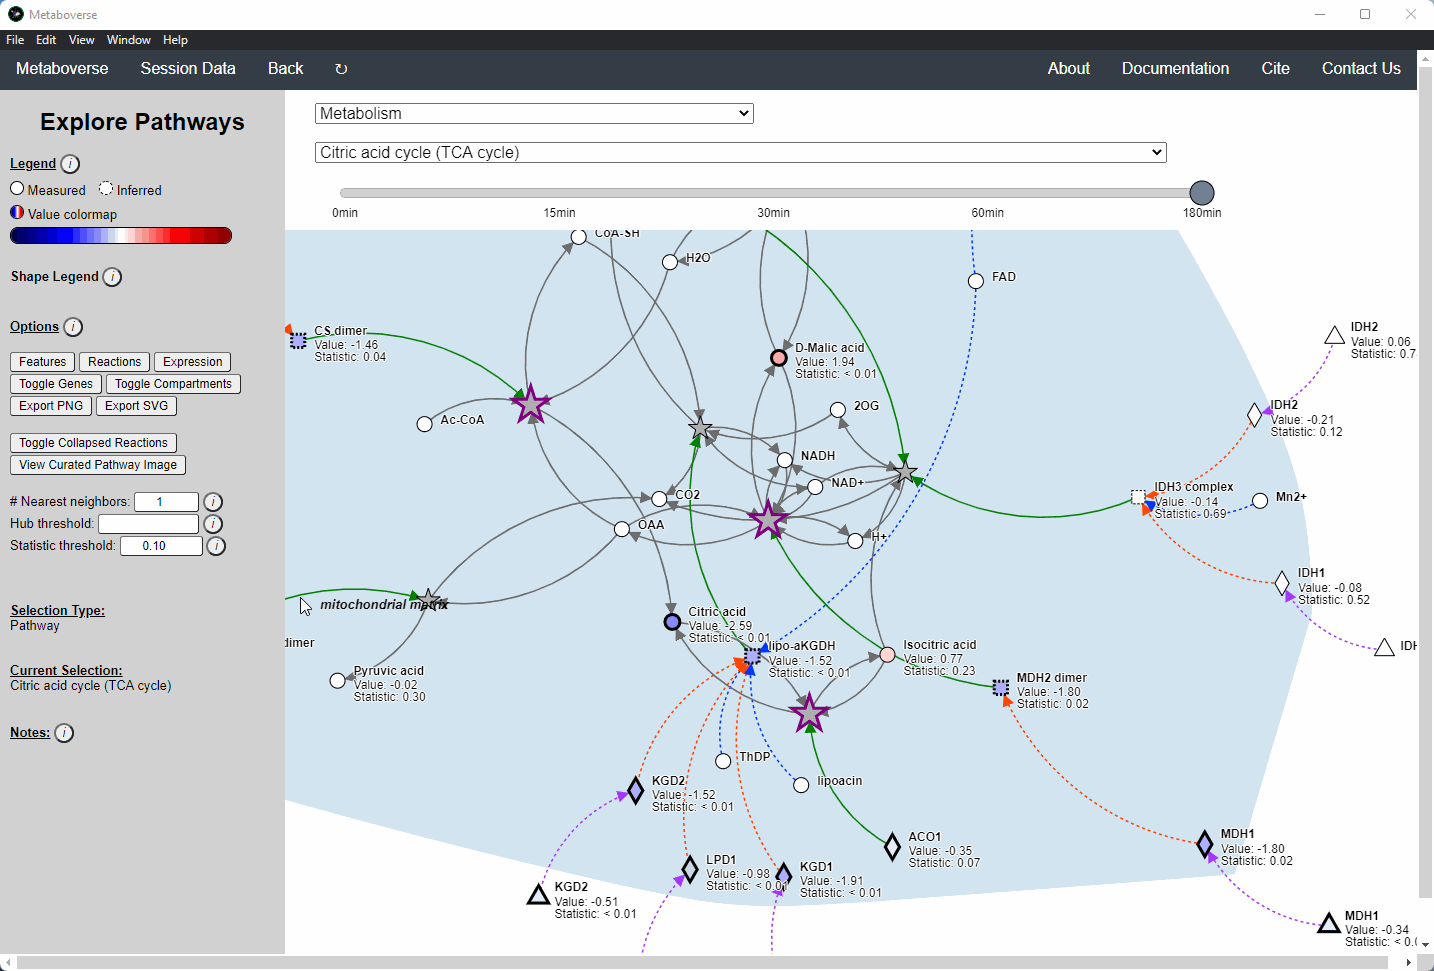
General Pathway Exploration
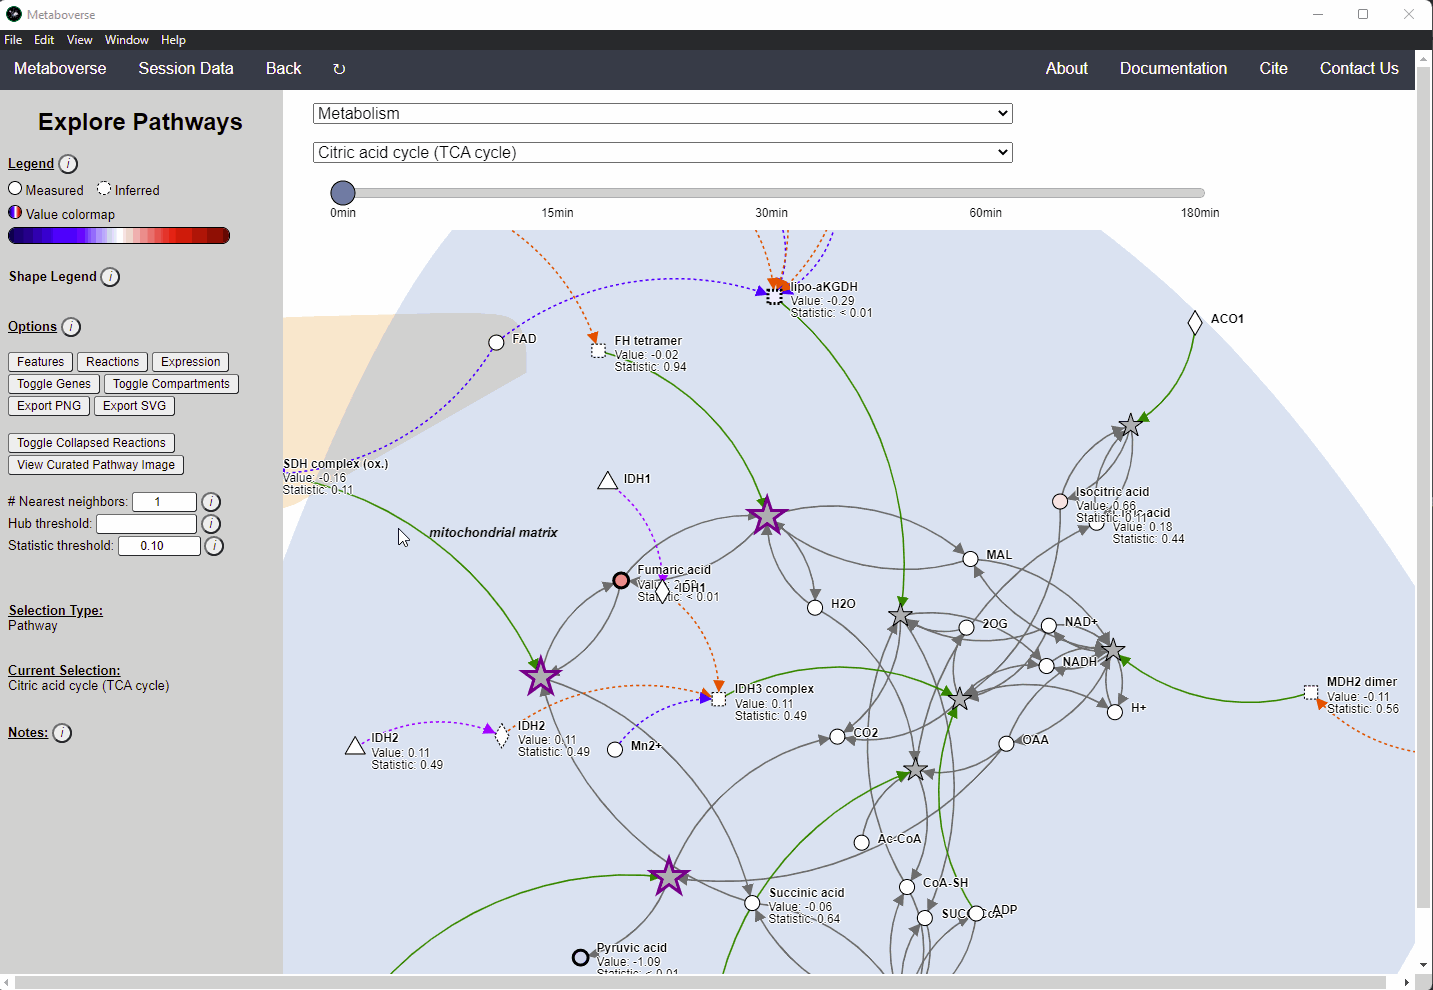
While the emphasis of Metaboverse is at the reaction level, where we do not want to bias our analysis towards a specific, familiar pathway, there may be cases where we are interested in a particular pathway and the patterns that emerge. We can access pathway-level visualization by clicking the
Explore button.a) At the top of the legend, reference to the node types are displayed. Grey nodes are reactions, nodes with solid outlines are measured, and nodes with dashed outlines are inferred using the gene broadcasting feature. Components with significant statistical values based on the threshold (defined in section d) are bolded. Users can hover across the color scale to see what color corresponds to what value.
Note
Identified reactions with a reaction pattern will have enlarged nodes and will be outlined in bold purple.
b) Relationship types between nodes are shown by hovering over the
Shape Legend icon. Compartment shadings for the selected pathway are shown by hovering over the Compartment Legend icon.c) Users can toggle component, reaction, and expression labels on and off using the appropriate buttons. Users can also toggle gene nodes and compartment shading on and off with the appropriate buttons. Users can also press the
Export PNG to select the viewed network to a png file. Users can decide whether to show collapsed reactions, or to show the full, non-collapsed pathway of reactions that would have been collapsed. Collapsed reactions are displayed by default. Users can also open the selected pathway in Reactome to view a more classical representation of the pathway.d) Users can modify the number of neighbors to plot when double-clicking on a node to expand its nearest reaction neighbors. Users can also select a threshold to not display any node with more than the defined number of connections. By modifying the statistic threshold, users can change the minimum statistical value needed to bold the component node for easy discrimination of significant measurements in the network.
e) Metadata about pathways, reactions, and components, along with warnings or errors, will be displayed in this section of the legend.
f) Users can select from the following super-menus:
- All entities: A list of all components (metabolites, proteins, etc.). This will draw the nearest neighborhood graph for the selected component.
- All pathways: A list of all pathways across all super-pathways.
- Other: A list of selected super-pathways that will group pathways in the next drop-down menu. For example, if selecting
Metabolism, only pathways related to Metabolism will be shown in the next menu.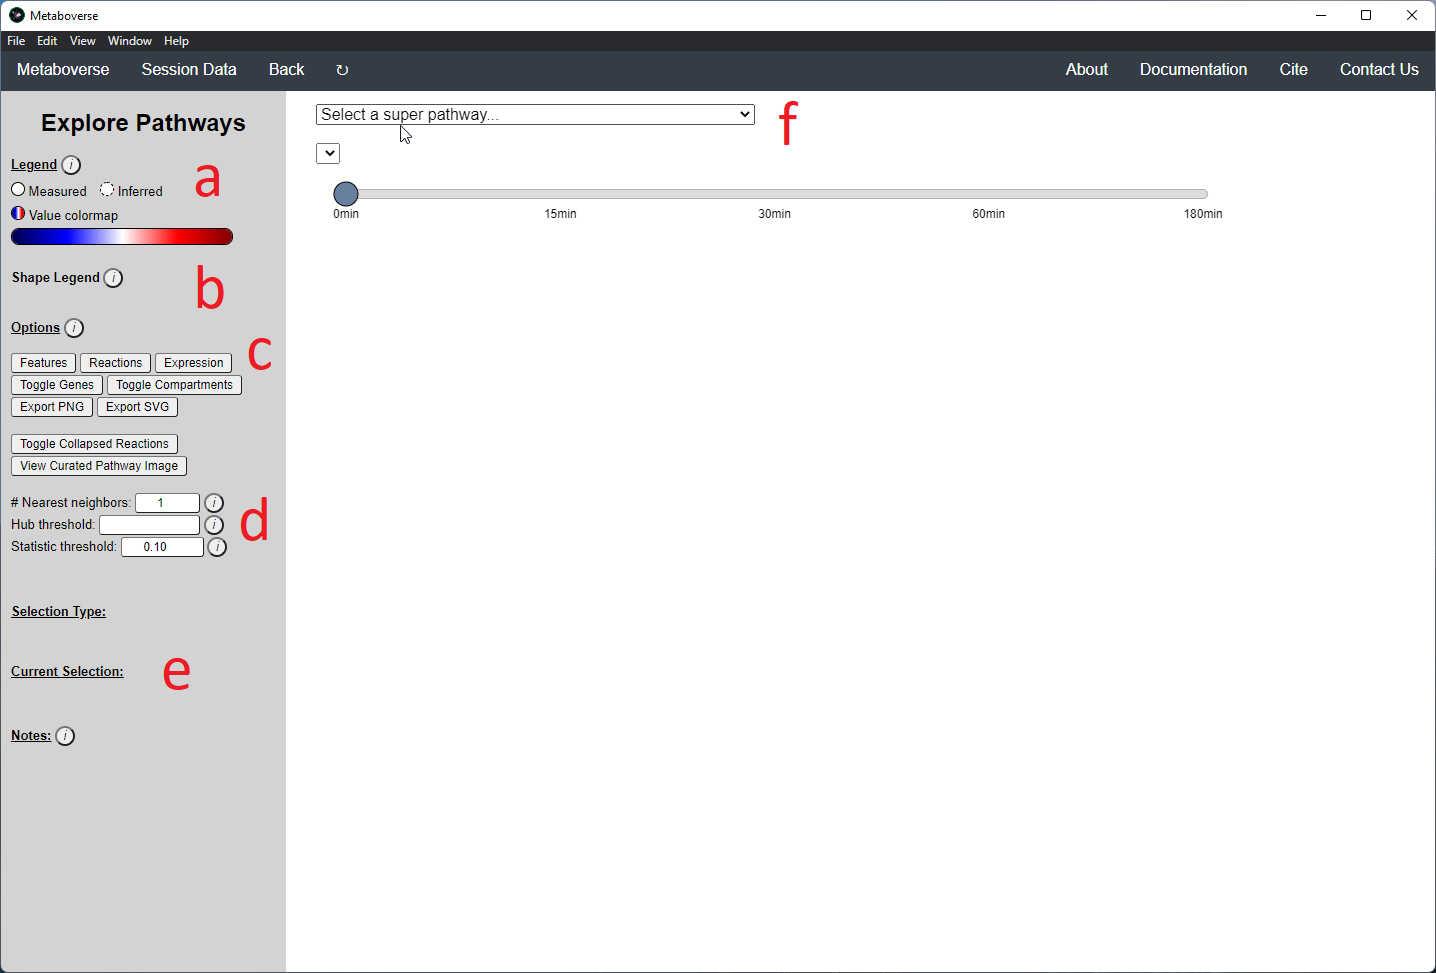
Users can easily toggle between timepoints or conditions by moving the slider.
Perturbation Network Modeling
Users can explore the role and extent of perturbation within the reaction network in their model by navigating to the appropriate page. Users can modify the perturbation threshold for the fold change or statistical value.
Investigating Upstream and Downstream Effects
Users interested in exploring a components reaction neighborhood can double-click the component to expand this view. The number of reaction neighbors can be selected, and limits on the number of connections a connecting component can have to be displayed can be modified. This hub selection is particularly helpful for connected components that are involved in several reactions.
Users can also target an entity for exploration directly by selecting
All entities in the Explore page from the Select a super-pathway... drop-down menu.Reaction Collapsing
Missing quantifications along the metabolic network are frequent with metabolomics data (Do, 2018; Chen, 2021). As Metaboverse is designed to identify patterns across reactions, missing data can greatly inhibit the ability to identify these patterns. Within Metaboverse, we implemented a reaction collapsing algorithm that can bridge multiple (up to 3) subsequent reactions with missing data at intermediate steps.
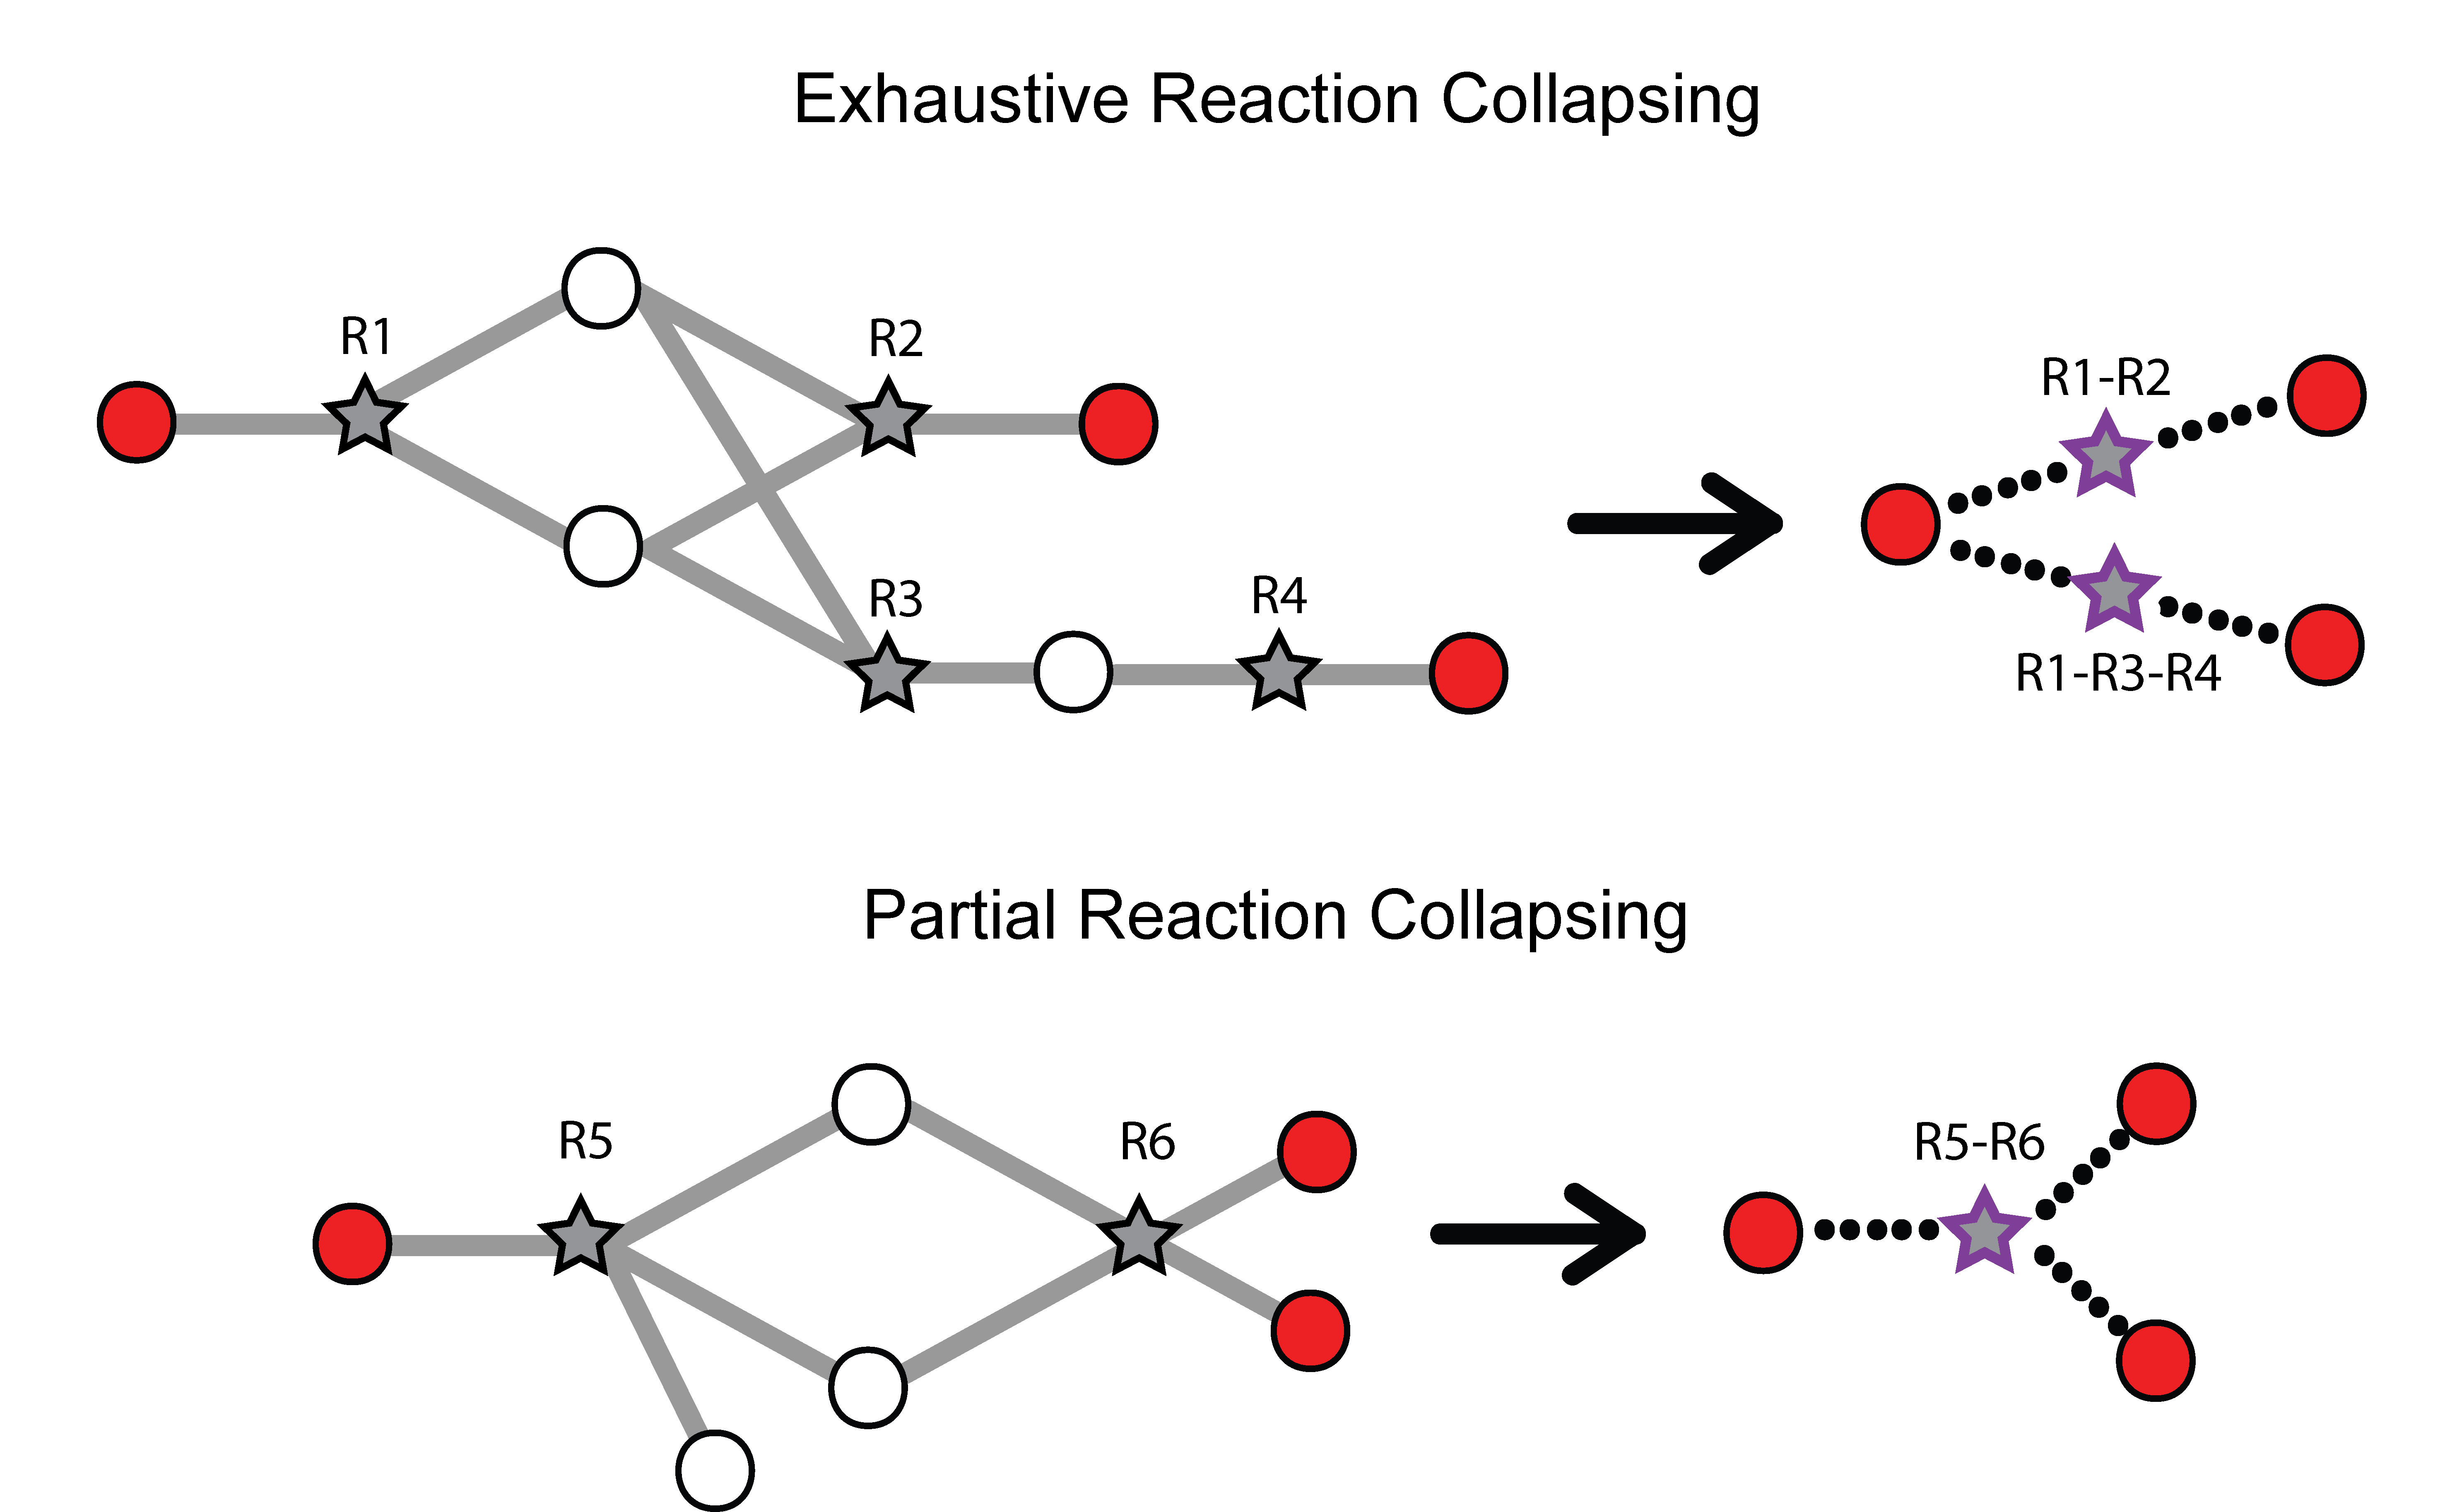
Within Metaboverse, you can toggle back and forth between networks with or without collapsed reaction representations.
Analyzing Complexes
During reaction pattern analysis, protein complexes consisting of multiple elements are aggregated to generate a pseudo fold change and statistical value by calculating the median of all magnitude changes and Euhler’s constant (e) x the geometric mean of the component statistical values. If the resulting aggregated statistical value is greater than 1, 1 is substituted.
We aimed to take a flexible approach that biases the representative fold change and statistical value towards the most frequent, so if most complex components are statistically significant with high fold changes, the resulting values will be so as well.
By unchecking the
Infer complexes box on the Reaction Pattern page, you can alternatively analyze complex components individually within that reaction, where Metaboverse will find the optimal element that will give the best magnitude difference to compare against the selected threshold.Analyzing Previous Models
Users can load a previously modeled network with their data on it by loading the
mvrs file output by Metaboverse when originally generated. This is done on the Home page.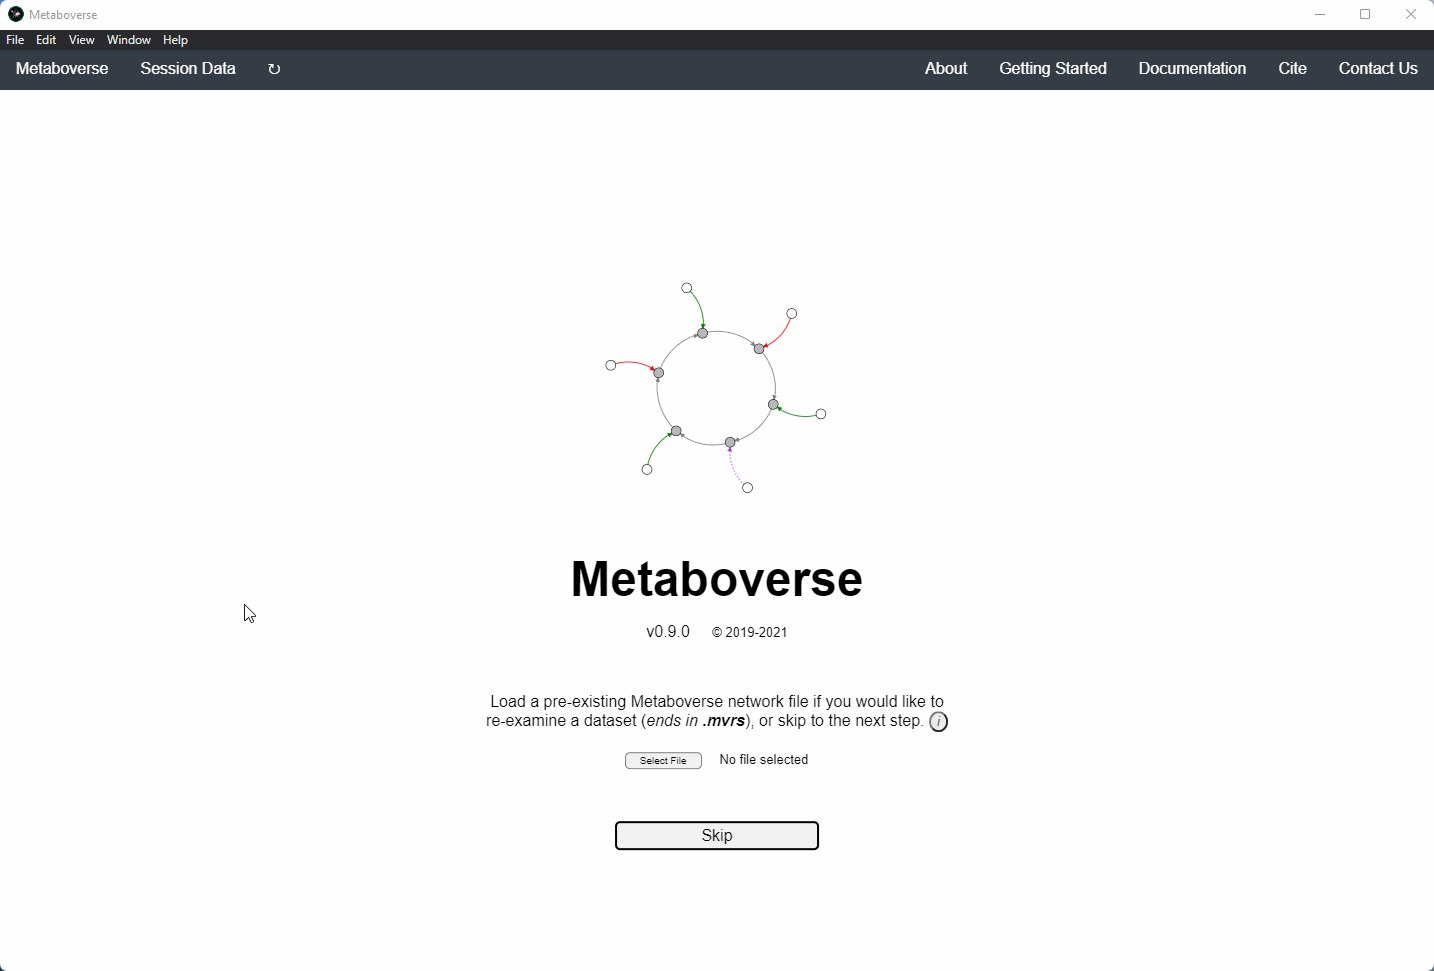
Users can load a previously modeled organism network by loading the
mvdb file output by Metaboverse when originally generated. This is done on the Curation page.
Publishing Data Analyzed with Metaboverse
When publishing analyses that used Metaboverse, we recommend attaching the appropriate
mvrs file that contains the network with your data overlaid as a supplementary file. This will allow for others to easily reproduce and explore your data.Users can explore the metadata related to their Metaboverse model by clicking on the
Session Data tab in the menu once the mvrs file is loaded.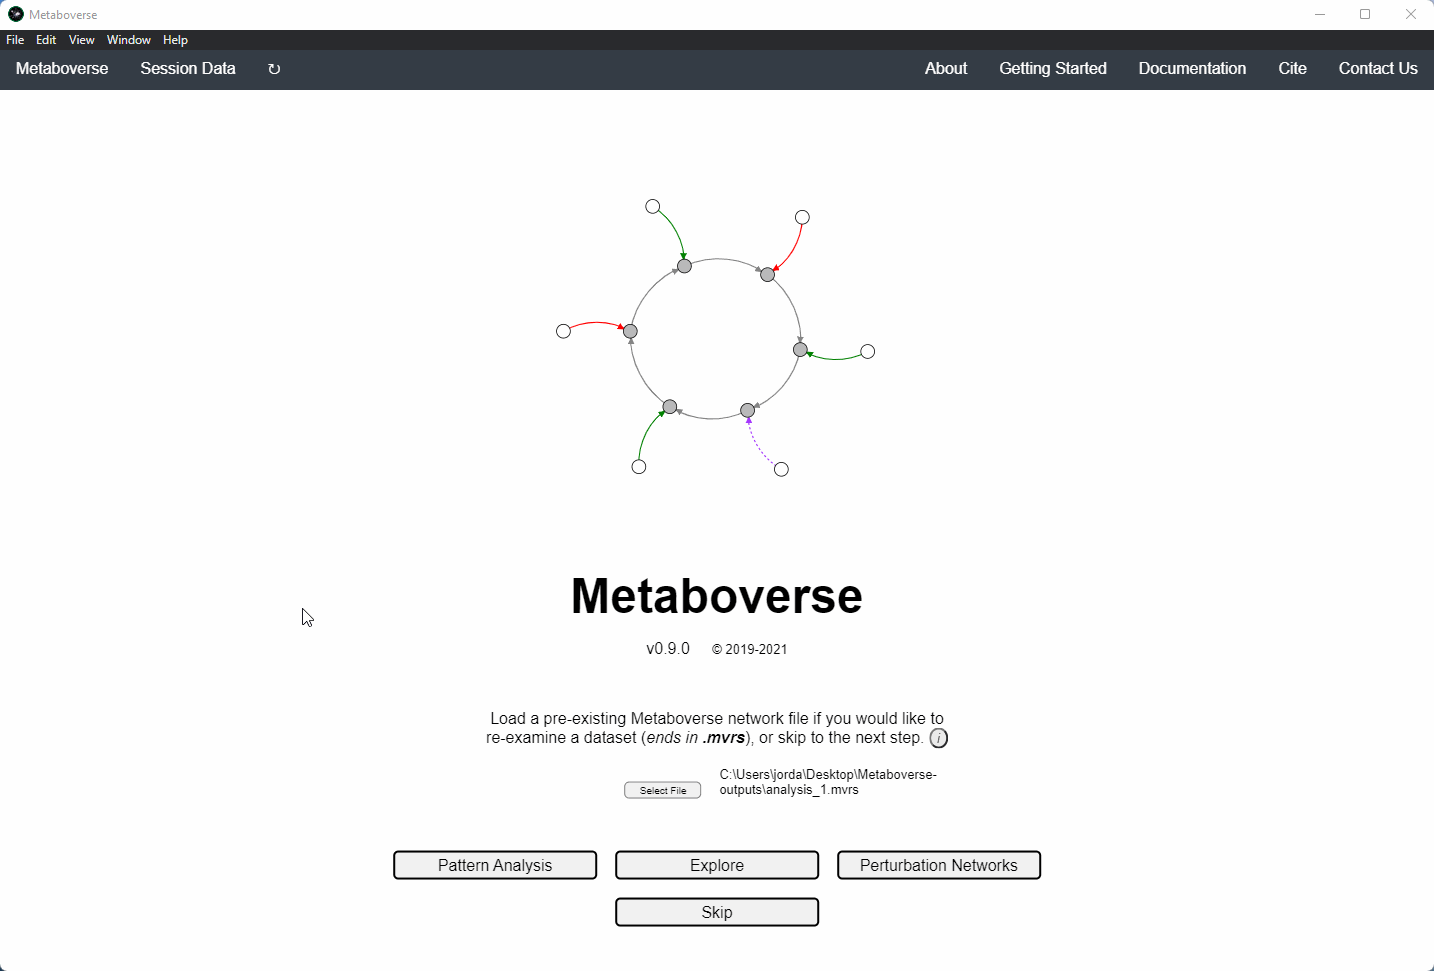
You can find more information on citing this software on the Citing Metaboverse page.