Overview
Background
Metaboverse is a cross-platform app built to aid users in contextualizing their data on their model’s metabolic and global reaction network. Metaboverse is an interactive tool for exploratory data analysis that searches user data in the context of the metabolic network to identify interesting patterns and trends within the data. Metaboverse will aid users in interactively identifying interesting patterns and regulatory hotspots within their data for further experimental follow-up. You can find some of the interesting patterns we have discovered here.
Important Note
If you ever have any questions about using a particular feature, or what a particular button does, try hovering your mouse over the button or feature and often a short explainer will pop out. You can also search the Docs for more in-depth information or refer to the manuscript.
For information on symbols in Metaboverse, please refer to the
Shape Legend and Compartment Legend references where applicable.Data Inputs
Metaboverse is capable of handling several data types and structures. Users can input any combination of paired transcriptomics and/or proteomics and/or metabolomics data for their model. Metaboverse relies on Ensemble IDs, UniProt IDs, and ChEBI IDs for data mapping, so any data type that is able to map back to one of these data types can be used. For example, ribosome profiling translation efficiency data mapped to Ensembl gene IDs can be overlaid on the network. Data format consists of row names with the entities of interest, a column of log2 Fold Change data, and a column of a statistical value. An example for each datatype can be seen below, where (A) shows single-condition data table examples, and (B) shows a single-timepoint proteomics dataset paired with a timecourse metabolomics dataset.
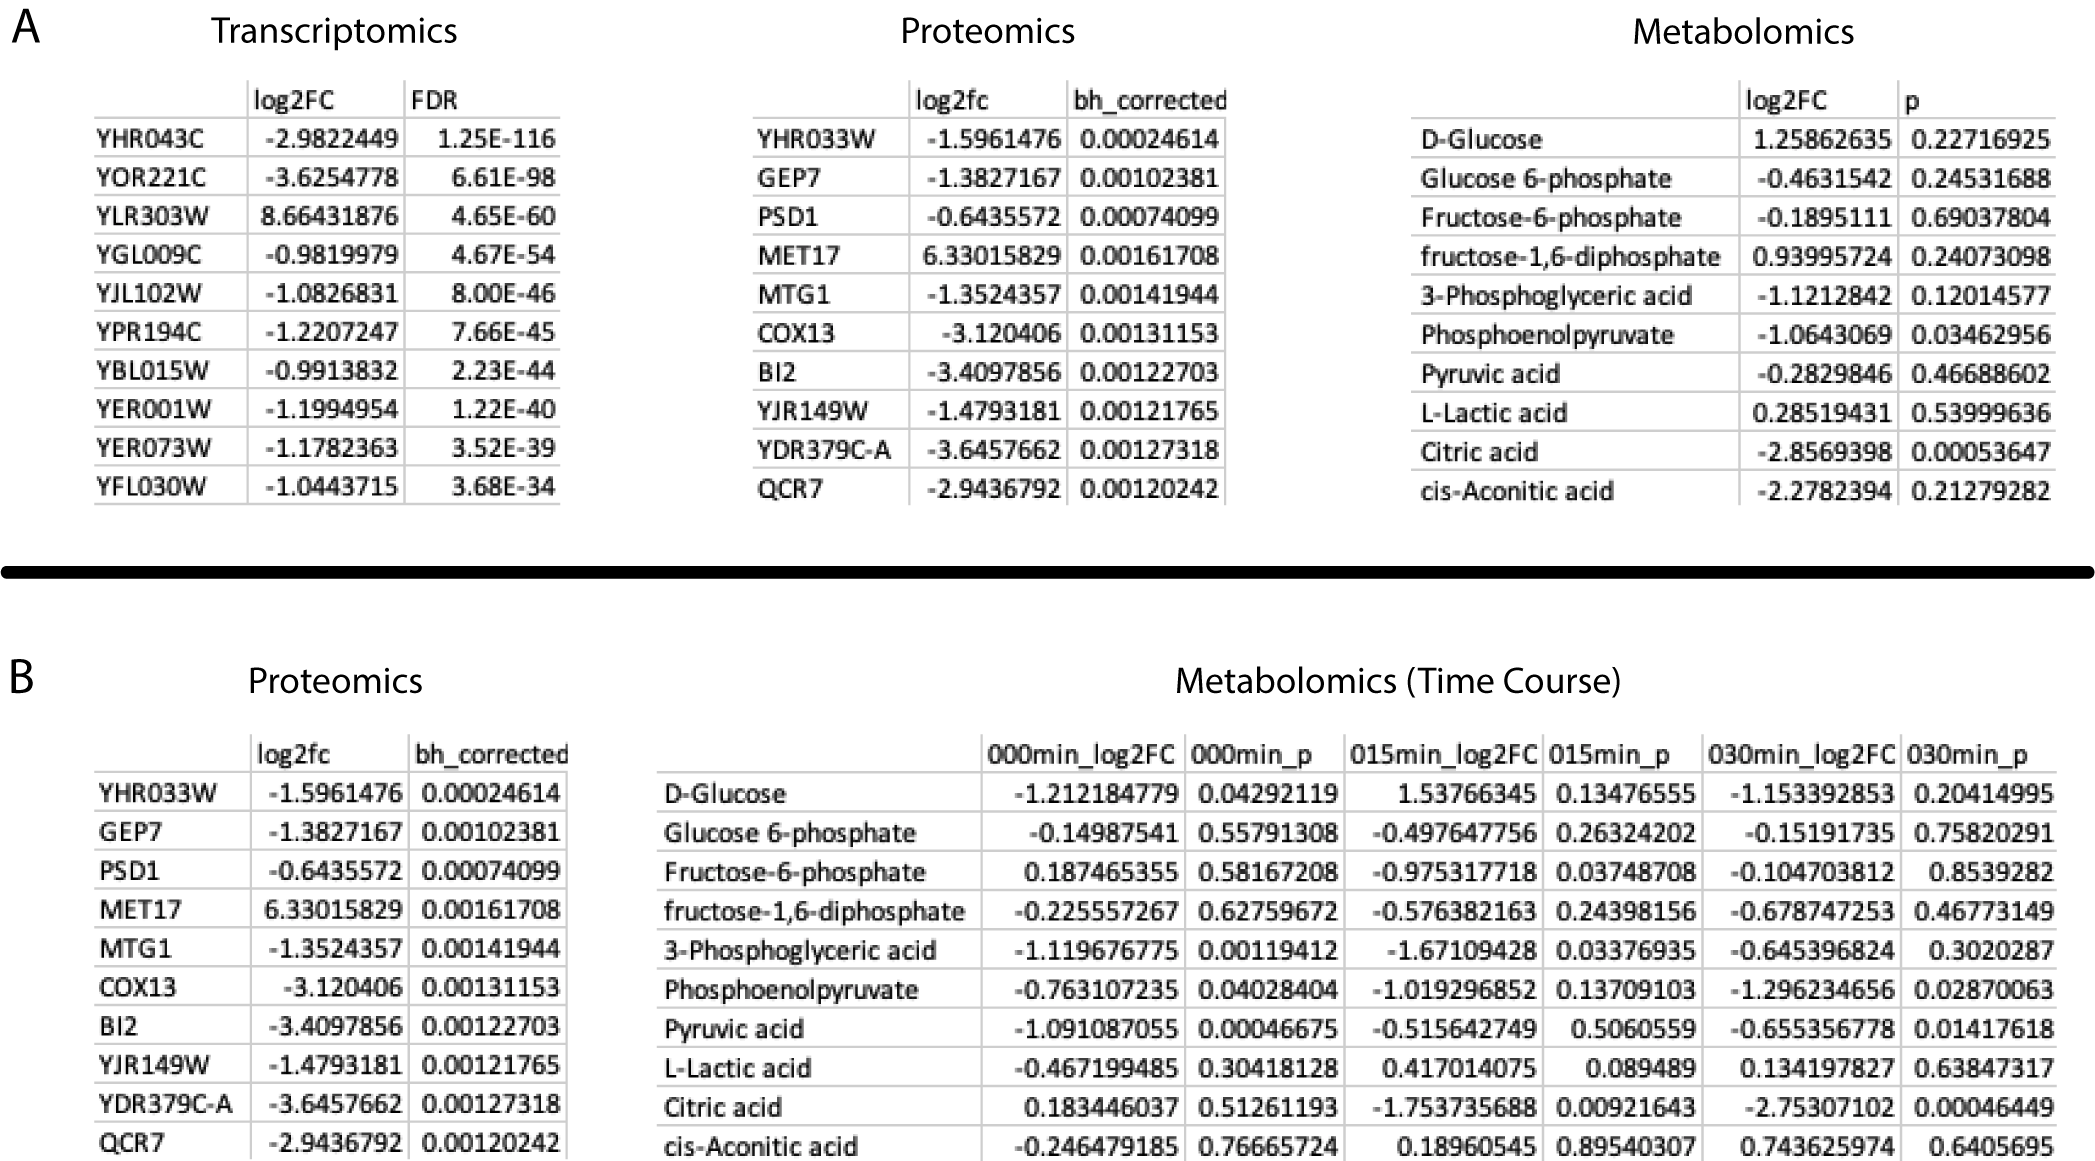
Along with single condition experiment set-ups, users can provide timecourse data by sequentially listing the fold change and statistical columns in temporal order in the input data table for that -omic type. Users can provide all paired -omics types for each time point, or provide one -omics table of timecourse data and a table for another -omics type with a single steady-state time point. In every situation, it is vital the user keeps in mind the caveats associated with comparing such mixed data types. Along with timecourse data, users can provide multiple conditions formatted as with the timecourse data.
The user may decide to select the desired statistical value based on numerous factors, including:
- How stringent of a multiple testing correction procedure they would like to use
- Whether or not multiple testing correction is necessary for an exploratory analysis
- Whether or not they would like to compare confidence intervals of comparison groups. Help with preparing confidence intervals can be found in the
Format Data option. Metaboverse expectes confidence intervals for each comparison to be formatted as:[
[0.9, [[21.5761801, 21.7571531], [24.3988067, 25.6011932]]],
[0.95, [[21.6215126, 21.7118207], [24.6999961, 25.3000038]]],
[0.99, [[21.6576415, 21.6756917], [24.9400369, 25.0599630]]]
]
This correlates with a list of lists, for the 90%, 95%, and 99% confidence intervals for each control and experimental group.
Users can also select the
Format Data option. Doing so will launch a new window where an unformatted datatable can be uploaded and the user can select the relevant samples to experimental or control groups for a single 2-condition comparison or multiple comparisons for time-course or multi-condition datasets. A description of the usage of this module can be found in the Data Formatting Help section.
Summary
- Each omic input should include fold change and statistal values.
- You may include any combination of corresponding transcriptomics AND/OR proteomics AND/OR metabolomics measurements.
- Timecourse data should be repeated fold change and statistical values for each timepoint in order (see example above).
- Multi-condition experiments can be provided as with timecourse data.
- Data names should correspond to Ensembl, UniProt, or ChEBI/KEGG/HMDB IDs and acceptable synonyms.
- Keep an eye out for measurements with weird characters in their names. This can often cause problems with the data mapping.
- Make sure the gene/protein/metabolite column name is blank, as shown in the examples.
Warning
For most consistent behavior, you should only use tab-delimited tables with the suffix txt or tsv.
For most consistent behavior, you should only symbolize a decimal with a period (.), NOT a comma (,).
Warning
If duplicate entity names are provided within a given transcriptomics, proteomics, or metabolomics data table, Metaboverse will ignore these elements.
Unmapped Data
During network modeling of user data, any user-provided datapoints that are unable to be mapped with be output as a tab-delimited table in the same location as the original input files with the suffix
_unmapped.txt. Data points could be unmapped for two reasons:- The data point is not curated in a reaction within the selected organism’s reaction network
- The provided data point name or ID is incompatible with the available synonyms for that entity within the network. Available synonyms are compatible: Ensembl gene ID or name; UniProt ID or name; ChEBI, KEGG, HMDB, JCBN, IUPAC, or MetaCyc IDs or names
- Try searching
Reactome + the name of the unmapped species online to see if the species goes by another name in Reactome, or if it is missing from the organism curation.Output File Types
There are two output file types associated with Metaboverse:
-
mvdb: This is the organismal curation file, containing the underlying network structure for the selected organism, as well as important node mapping information for connecting user-provided gene, protein, and metabolite measurements to the appropriate locations in the network.-
mvrs: This is the completed organismal curation file, with your gene/protein/metabolite measurements mapped onto the network. You can load this file on the home page within the Metaboverse app to pick up where you left off in your analysis of the data.Using Metaboverse
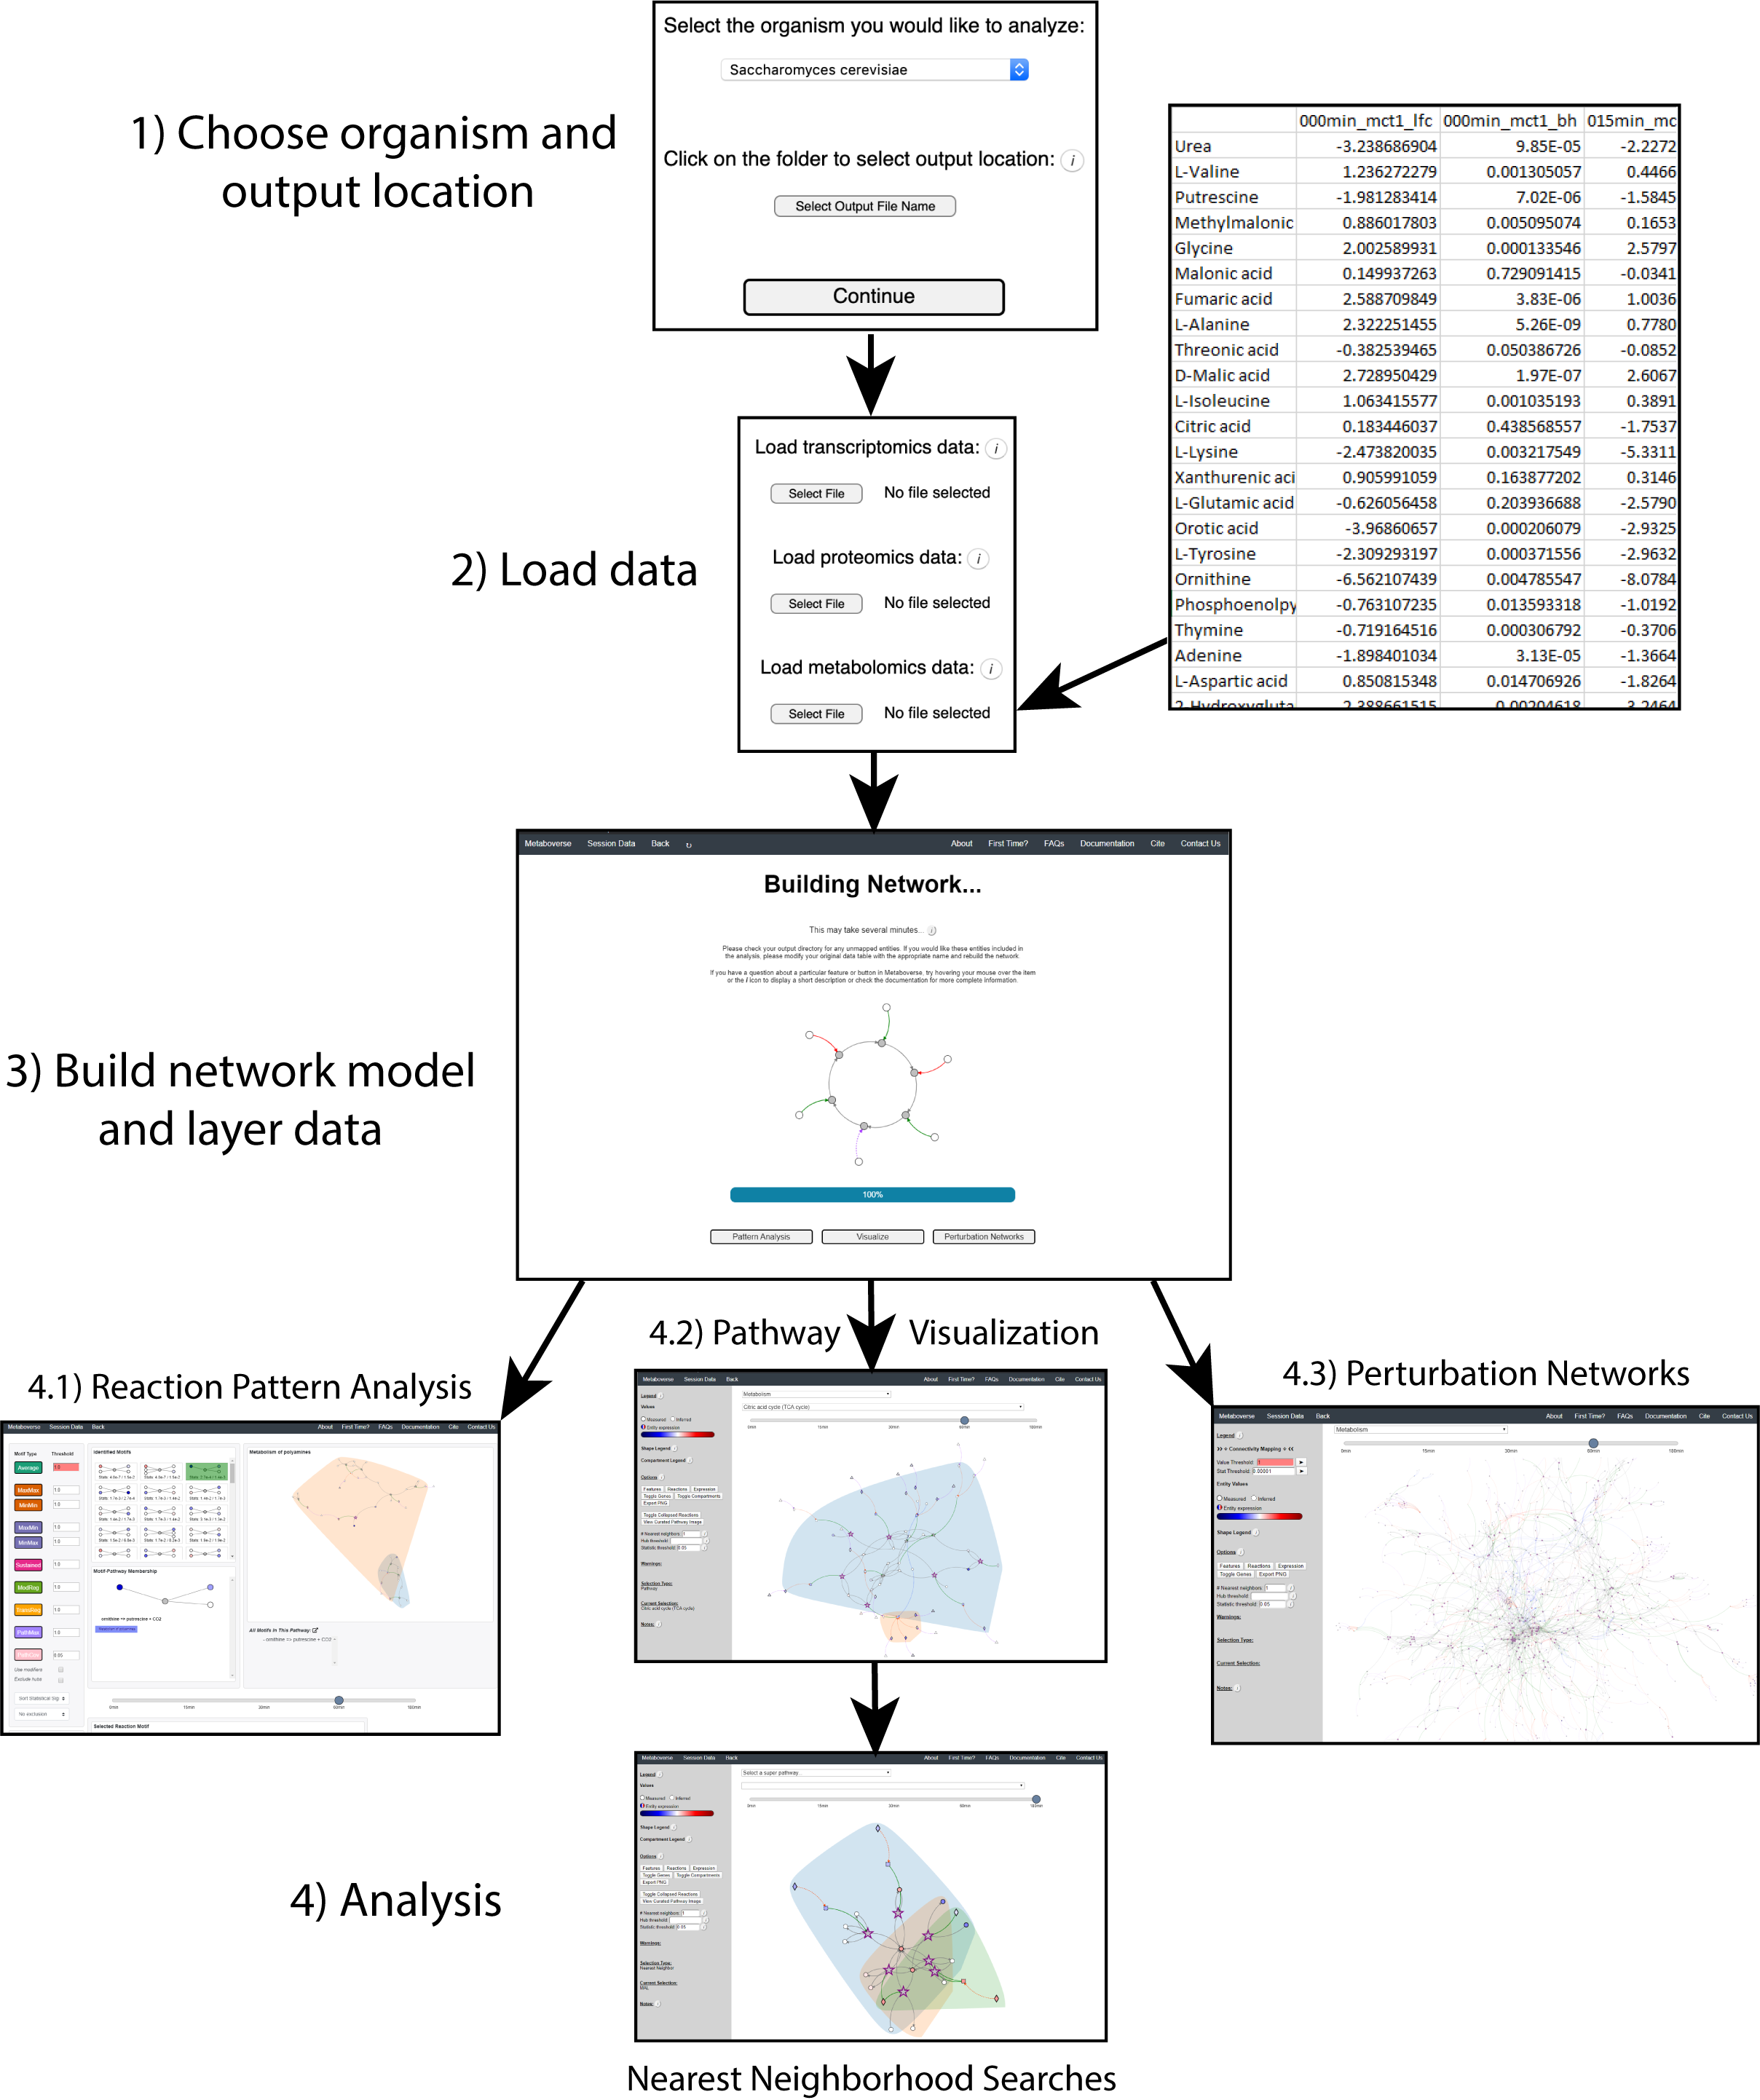
Metaboverse first asks users for the organism of interest and an output folder to store all output data and network representations. Afterwards, the user will be directed to provide any -omics data tables, along with some basic metadata, such as experimental setup, timecourse labels, etc. After this input is provided, the network will be modeled with the user’s data overlaid. Two files will then be output to the location specified by the user. The first will be a file ending in
mvdb, which contains the basic information needed to model the organism network without user data. This file can be saved for future usage if the user wishes to remodel data on that organism’s network without have to wait for all the necessary source files to download. This file can be provided in leiu of the organism name and file output on the appropriate page.The second file ends in
mvrs and contains the final network with the user data and user metadata stored. This file will allow for all downstream visualizations and analyses and can be reloaded on the main page of Metaboverse to quickly re-analyze a dataset. Clicking on the Session Data tab in the menu on each page of Metaboverse will display the appropriate metadata for that particular model.The figure below shows an example of this process.
For more details on using each analytical feature within Metaboverse, please refer to the Walkthrough page.
TL;DR
* Users specify organism, output location, -omics files, and basic experimental metadata by following the prompts.
* User data is layered onto the reaction network.
*
mvdb and mvrs files can be saved to quickly access the organism curation or data model. For v0.3.0b or earlier, these files ended in pickle and json, respectively.* Once data is modeled on the network, the user can begin interactive analysis of their data.
Important Features of Metaboverse
While many tools currently available provide capabilities to analyze data on metabolic networks, we introduce several new or improved features in metabolic network analysis that aid in more robust, unbiased network analysis of biological data. These features are outlined below:
* Collapsing data sparsity: Due to the challenges in metabolomics revolving around missing values for metabolites in a reaction pathway, data sparsity can impede in the analytical process. We address this issue by introducing a reaction collapse scheme, that creates pseudo-reactions where up to 3 reactions have missing data points between the reactions, but the external ends of the reactions in this sub-path have measured values.
* Dynamic Network Visualization: The Metaboverse provides an interactive app that allows for dynamic exploration of regulatory hotspots, perturbation networks, and general visualization. Users can add or remove metabolites or other entities from being visualized, which is particularly useful in cases of highly connected metabolites, such as water, which clutter the visualization and do not contribute much to the interpretation of the data. Users can toggle on or off labels and features, drag and rearrange components of the networks, and more.
* Identifying Regulatory Patterns: In order to identify reactions where interesting regulatory events are occurring based on the provided -omic data, we introduce a regulatory hotspot search engine, which is based on concepts from activity motifs. Several hotspot patterns are pre-programmed into Metaboverse to allow the users to explore different regulatory patterns present in the data. In the future, we plan to include an interactive interface to allow users to design and implement custom search patterns.
* Modeling Perturbation Networks: Users can specify the threshold needed to consider a reaction perturbed and stitch together each of these reactions passing the threshold to reveal a perturbation network. This allows for the visualization of connected perturbations along a pathway and may indicate interesting characteristics of a condition that may complicate certain treatments if, for example, a drug targets a perturbed reaction, but the reaction downstream is also perturbed for independent reasons from the first and could thus reduce efficacy of the drug treatment.
* Exploring global consequences of a change: In the
Exploration page, you can double-click on any reaction component and explore all connected reactions to this component across the total reaction network, not just the selected pathway. Additionally, you can select All entities from the Select a super-pathway... drop-down menu to select any component from the total network for this type of exploration.Performance
Performance will vary network to network. For example, the curation and modeling of data on a yeast network will process several times faster (5-10min) than data modeled on a human network (20-30min).
For pre-curated reference files (where you do not force a fresh curation), this total process should only take a few minutes, even for a human network, and depends more on your internet conneciton speed.
You may experience a network taking longer to curate, but as long as no error messages appear, it is probably still working. Certain steps that are particular computationally intensive may pause the completion % for a couple minutes, but Metaboverse may still be working.
Technical Description
Metaboverse is currently segmented into two parts:
1.
Metaboverse interactive app: The platform-independent app for visualizing and exploring data on the metabolic network. [code]2.
metaboverse-cli: The network curation and modeling utilities that form the back-end of the Metaboverse app. For each release of Metaboverse, OS-specific binaries are generated of the backend and incorporating into the GUI app. [code]Metaboverse works by doing the following:
1. Generates an organism-specific reaction network using the Reactome Knowledgebase
3. Generates a network-based reaction model
4. Layers user data onto the global reaction network
5. Optionally broadcasts gene expression data to protein expression nodes where protein values are unavailable
6. Prevent the visualization of certain nodes to create simplified visualizations of pathways
7. Runs just-in-time searches of the global network for regulatory patterns of interest centered around a reaction
8. Generates just-in-time visualizations of global or super-pathway-specific perturbation networks
9. Generates just-in-time general visualization of canonical pathways